What is Market Cap in Crypto?

Crypto market cap combines a token’s price with its circulating supply. It helps compare assets of different sizes, but says little on its own about liquidity, ownership rights or future returns.
What Does Crypto Market Cap Measure?
Market capitalisation is the reference price of a cryptocurrency multiplied by its estimated circulating supply. The calculation assigns the same unit price to every token included in that supply figure, producing a calculated market value for the circulating tokens.
HYPOTHETICAL MARKET-CAP CALCULATION
$2 per token × 50 million circulating tokens
= $100 million market cap
The reference price is the price selected or calculated by the data provider, often using several trading venues. Providers also apply supply-verification and asset-inclusion rules. The CoinMarketCap methodology uses circulating market capitalisation for its rankings.
Why Token Price Alone Can Mislead
A low price per token can reflect a large number of units. A small unit price alone gives no indication of whether the asset is undervalued. The same investment amount can buy many units of one token or a fraction of another without revealing which has greater growth potential.
| Asset | Price | Circulating supply | Market cap |
|---|---|---|---|
| Token A | $0.01 | 100 billion | $1 billion |
| Token B | $100 | 1 million | $100 million |
Market cap corrects for that unit-count difference. It still does not say whether either token’s price is justified by demand, utility or the economic rights it gives holders.
Large-Cap, Mid-Cap and Small-Cap Crypto
These labels group assets by size, using conventions that vary across publishers and market cycles. One illustrative classification calls assets above $10 billion large-cap, those from $1 billion to $10 billion mid-cap, and those below $1 billion small-cap. These are illustrative publishing conventions, not regulatory categories.
The labels organise size comparisons. Investment quality requires a separate assessment: a large-cap asset can suffer severe losses, while a small-cap asset can have concentrated ownership, weak liquidity or uncertain supply data. A smaller starting valuation alone does not make a higher future valuation likely.
Circulating Supply, Total Supply and FDV
Circulating supply estimates the tokens available in the public market under a provider’s rules. It is not simply the sum of balances in user wallets: locked allocations, treasury holdings and insider-controlled tokens may require separate treatment. Unlocking makes a token transferable, but a provider may still exclude it because of its ownership or allocation.
Total supply generally means tokens already created, less recognised burns. Maximum supply is the protocol’s stated upper limit where one exists. Some assets have no fixed finite maximum. CoinMarketCap’s supply methodology distinguishes these measures and separates circulating from unlocked supply.
Supply map — hypothetical 100 million maximum
- 50 million circulating — dark teal.
- 30 million minted but non-circulating — light teal; assumed locked in this example.
- 20 million not yet minted — grey.
Only 80 million tokens exist in this example; the maximum permits another 20 million. At the assumed $2 price:
Fully diluted valuation, or FDV, applies the current price to a broader supply measure. The cited CoinMarketCap methodology defines it using maximum supply; the linked CoinGecko explanation uses total supply. These describe the cited pages, not a universal rule for every field or asset. Check which supply figure the service uses for the displayed valuation.
A total-supply calculation includes existing tokens; a maximum-supply calculation can also include tokens not yet created. Both apply today’s price to the selected supply. When allocations unlock, recipients can hold, stake, transfer or sell them, so evaluating future releases also requires the schedule, ownership and expected demand.
Two Different Supply Models
Bitcoin creates additional coins through issuance within its 21 million maximum. That ceiling applies to the eventual coin count; its dollar market cap can continue changing with price.
For XRP, the original supply already exists. XRPL’s documentation states that 100 billion XRP were created. An escrow release changes transfer restrictions rather than creating new XRP. The remaining total supply reflects burns, while the circulating estimate also depends on how holdings are classified.
How Repricing Changes Market Cap
A reference price changes as trading prices and the provider’s selected market data change. Applying that new price to the circulating supply revalues tokens that have not traded. Market-cap gains and losses therefore differ from the amount of cash entering or leaving an asset.
Repricing 50 million tokens — supply held constant
Price $2 → market cap $100 million
Price $3 → market cap $150 million
Valuation increase: $50 million.
A seller needs buyers at prices at which they will actually trade. Bids are outstanding offers to buy. Selling a large holding can use up the bids near the reference price and reach lower bids, leaving proceeds well below the holding’s displayed value. Market cap is not a cash reserve available for withdrawal.
Market Cap, Volume and Liquidity Measure Different Things
A large valuation and active trading can coexist with poor execution for a particular order. The spread is the gap between the best buying and selling quotes; market depth shows quantities available at different prices. Wash trading creates misleading turnover without genuine independent buying and selling, making reported activity a potentially unreliable guide.
| Metric | What it measures | Useful question |
|---|---|---|
| Market cap | The size of the circulating valuation. | How large is the asset’s circulating valuation? |
| Trading volume | Completed trading activity over a stated period. | Where and how reliably is activity being reported? |
| Spread and market depth | The available trading conditions for a new order. | What would this order cost to execute? |
CoinMarketCap’s market-data methodology treats liquidity separately from raw volume, using order-book information. Examine the venue and pair you would actually use. Our guide to what to know before trading crypto explains order-book depth and execution prices.
Total Crypto Market Cap and Bitcoin Dominance
What the Total Includes
Total crypto market cap adds the qualifying asset valuations for the assets included by that provider. It is not a census of every token or a measure of the industry’s cash reserves. Changes can reflect price moves, issuance, burns, new listings and revisions to supply estimates.
Providers also make choices about overlapping assets. CoinGecko’s global chart excludes crypto-backed wrapped, bridged and staked tokens to avoid double counting. Simply adding every token’s displayed cap could otherwise count both an underlying asset and a claim representing it.
Stablecoins require separate interpretation. Where included, their market caps can grow through issuance even when volatile crypto prices are unchanged. A larger stablecoin valuation does not establish that the corresponding funds have been spent buying Bitcoin or altcoins.
How Bitcoin Dominance Is Calculated
Bitcoin dominance is Bitcoin’s market cap divided by total crypto market cap, expressed as a percentage. Use Bitcoin’s valuation and the total from the same provider. A rising percentage can reflect Bitcoin gains, losses elsewhere, or changes in which assets are counted.
Hypothetical dominance: $600 billion Bitcoin market cap ÷ $1 trillion total market cap × 100 = 60%.
Using Market Cap to Test a Price Target
A price target becomes easier to assess when translated into a valuation. Use the circulating supply expected at the target date, with its assumptions stated. Holding today’s supply constant can materially understate the implied market cap for an asset with substantial future releases.
| Price → valuation | $5 × 50 million circulating tokens = $250 million |
|---|---|
| More circulating supply | $5 × 80 million circulating tokens = $400 million |
| Valuation → price | $400 million ÷ 80 million circulating tokens = $5 per token |
The calculation shows the valuation required by the target. Whether buyers support it depends on demand and supply at the time. For a comparison with another asset, match the valuation date and consider differences in utility, rights and available supply.
How to Check Market-Cap Data
For a current ranking, start with a provider’s market-cap listing. Record the asset, currency and retrieval time; check the price source, then the supply figure and its verification label. When services disagree, compare their timestamps, market coverage and supply classifications before treating one figure as incorrect.
The screenshots below show earlier interfaces and historical figures.
MarketCapOf: Hypothetical Valuation Comparisons
MarketCapOf calculates what an asset’s unit price would be at another asset’s market cap. The reverse calculation above shows how that scenario is built.
Its methodology, updated on 20 October 2026, identifies CoinGecko as its crypto-data source and describes update intervals. The two displays can consequently share the same underlying inputs.
CoinGecko: Rankings and Supply Sources
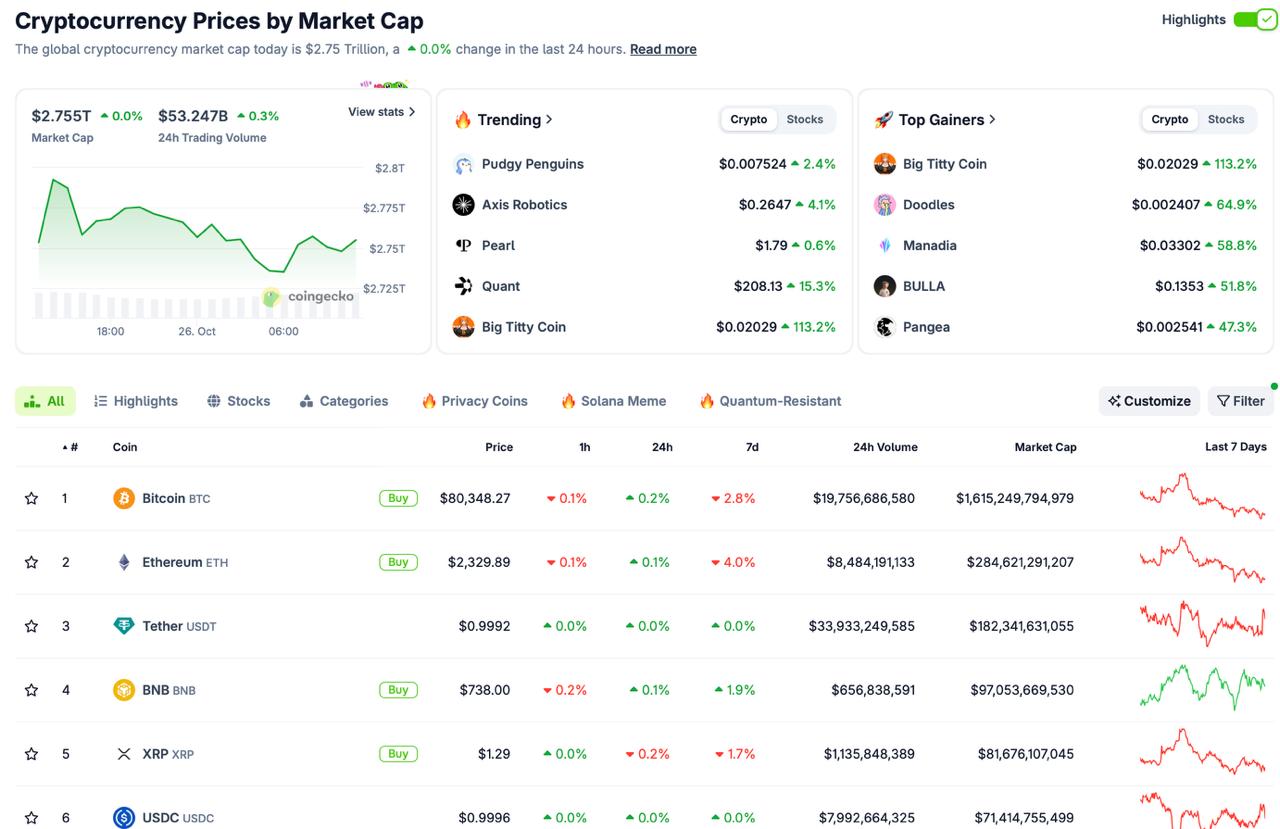
CoinGecko provides asset rankings, supply measures and market listings. Its methodology explains price aggregation and supply verification. The supply information and linked sources help explain how the circulating figure was obtained.
For cross-chain tokens, the supply FAQ distinguishes native issuance from bridge arrangements. That matters when tokens are locked on one chain and representations are minted on another.
CoinMarketCap: Supply Verification and Market Quality
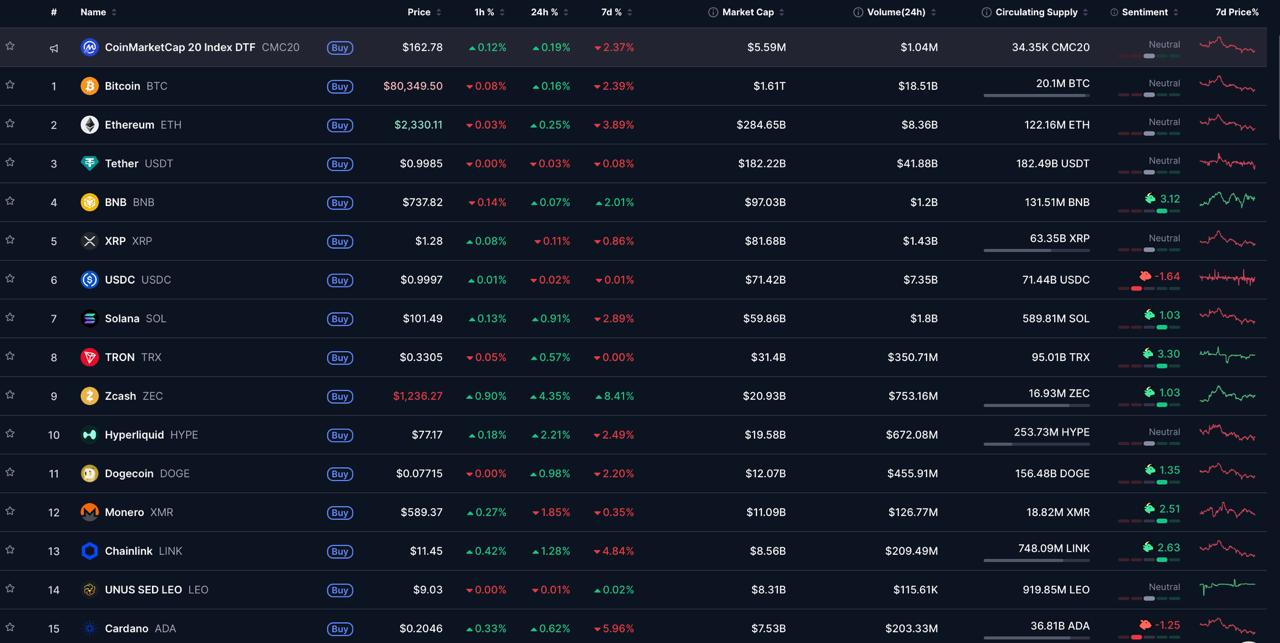
CoinMarketCap publishes rankings, supply figures and trading-market information. Verification labels distinguish a project’s submitted estimate from the supply figure used in the provider’s rankings where those values differ.
Its unlock calendar can help identify scheduled releases. The calendar is useful for locating release dates to compare with the project’s own schedule.
CryptoCompare and CoinDesk Data
CryptoCompare remains a retail market-information site associated with the wider data business. CoinDesk acquired CCData and CryptoCompare in October 2024.
For historical prices, order books or data accessed through an API, the current CoinDesk Data service provides a separate research route. Its documentation describes the coverage and available data feeds, while the retail site offers a market dashboard.
FAQ
Why Is a Token’s Market Cap Unavailable?
A provider may lack a reliable price, verified supply or sufficient data to publish the calculation. An unavailable figure does not mean the token has zero value. Read the provider’s explanation before substituting a self-reported estimate.
Can Market Cap Rise While Price Falls?
Yes, if the counted circulating supply rises enough to outweigh the price decline. Supply updates can also change the published figure without representing new investment.
Does Burning Tokens Automatically Increase Price?
No. At an unchanged price, a reduction in the supply used for market cap reduces that calculated valuation. Any price response depends on demand, expectations and which tokens were removed. A burn of previously excluded tokens may leave circulating supply unchanged.
Is Token Market Cap the Same as Company Equity Value?
No. Shares represent equity rights in a company. A token’s rights depend on its design and legal terms, and may provide no ownership claim on a company’s assets or earnings. The similar calculation does not make the underlying rights equivalent.



With over 6 years of experience in the world of financial markets and cryptocurrencies, Teodor Volkov provides in-depth analyses, up-to-date news, and strategic forecasts for investors and enthusiasts. His professionalism and sense of market trends make the information he shares reliable and valuable for everyone who wants to make informed decisions.