Technical vs. Fundamental Analysis in Crypto: Definitions, Differences, and Which is Better
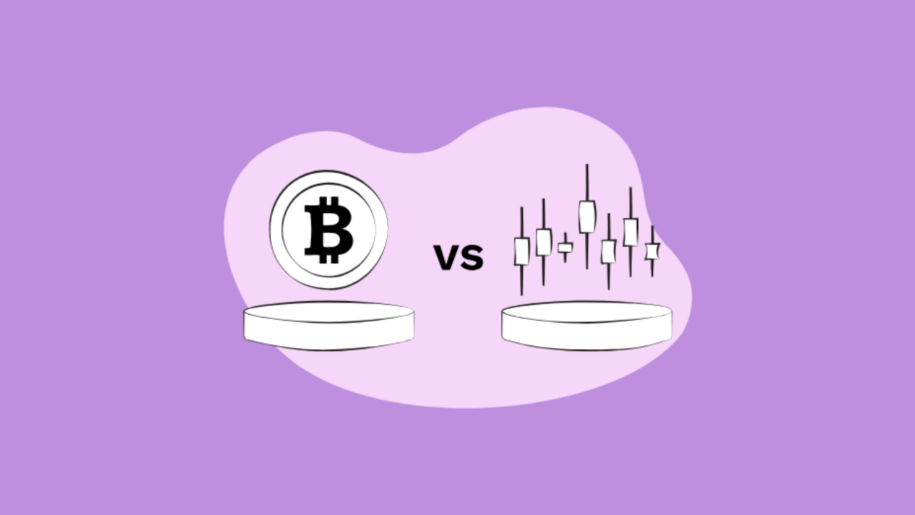
Technical and fundamental analysis answer different questions about crypto: one examines price and market behavior, while the other studies the asset, network, token economics and underlying demand.
- Updated September 10, 2026
Table of Contents
- Technical vs. Fundamental Analysis: The Difference at a Glance
- What Technical Analysis Shows
- What Fundamental Analysis Looks Like in Crypto
- Where Technical and Fundamental Data Overlap
- When Technical and Fundamental Signals Disagree
- Limitations of Both Approaches
- How to Use Technical and Fundamental Analysis Together
- Which Approach Should You Use?
- Technical vs. Fundamental Analysis FAQ
Technical vs. Fundamental Analysis: The Difference at a Glance
Technical analysis reads the market through price, volume, momentum and positioning. Fundamental analysis examines the economic and network factors that may support sustained demand for the asset.
Time horizon does not define the difference between the two methods. Technical analysis can be applied to intraday charts or multi-year price structures, while fundamentals can change quickly after an exploit, token unlock, governance decision or protocol upgrade.
What Technical Analysis Shows
Technical analysis, or TA, uses market data to identify trends, key price levels, momentum and conditions that would weaken or invalidate a trade setup.
The starting point is usually price structure. A market producing higher highs and higher lows is behaving differently from one that repeatedly forms lower highs and lower lows. Support marks an area where buyers have previously become more active, while resistance shows where sellers have previously limited an advance.
Traders generally watch how price reacts around these areas rather than treating the level itself as a signal. Charting platforms such as TradingView make it possible to compare that structure across different timeframes, indicators and trading pairs.
Our guide to reading crypto charts covers candlesticks, timeframes and chart structure in more detail.
Momentum, volume and common chart tools
Moving averages are often used to track the direction and persistence of a trend, while RSI and MACD give another view of momentum. These indicators are calculated from historical market data, so they are most useful when read alongside the price structure rather than in isolation.
Volume helps show how much participation sits behind a move. A breakout on unusually strong volume has a different market profile from the same move in a thin market.
Traders may also use chart formations such as triangles, double tops or head and shoulders, along with Fibonacci retracement levels. These are reference tools for organizing price behavior, not standalone forecasting rules.
Crypto derivatives add positioning data
Crypto markets also provide information about leveraged positioning. Data services such as CoinGlass track:
- Open interest – outstanding derivatives positions;
- Funding rates – the cost of maintaining perpetual futures positions;
- Liquidations – leveraged positions closed after margin requirements are breached.
For example, a rally accompanied by rapidly rising open interest may be relying more heavily on leveraged derivatives than a similar move driven mainly by spot demand.
What Fundamental Analysis Looks Like in Crypto
Fundamental analysis in crypto differs from conventional stock analysis because many tokens provide no contractual claim on earnings, cash flow or company assets. The task is therefore to examine the factors that could strengthen or weaken demand for the asset and the system behind it.
Token supply and demand
Token supply can change the investment case even when the current market cap looks modest. Four questions usually deserve attention:
- How much of the supply is circulating?
- When are major token unlocks scheduled?
- How quickly are new tokens being issued?
- What creates demand for the token itself?
Market-data services such as CoinGecko can provide circulating-supply and valuation figures, while Tokenomist tracks vesting and scheduled token releases.
Usage and project fundamentals
A decentralized exchange can be examined through trading volume, liquidity, users and fees. For a lending protocol, deposits, outstanding loans and utilization may tell more. Blockchain analysis may involve transaction activity, fees, applications, stablecoin usage and validator participation.
DefiLlama provides many of these protocol and network metrics. Incentives can inflate deposits, bots can increase transaction counts, and high TVL may coexist with weak fee generation, so headline numbers need context.
Fundamental research also covers development, governance, security and competition. A project with growing usage can still face concentrated admin control, weak token economics or technical dependencies that materially change the investment case.
For a deeper project-level review, our altcoin research guide covers token supply, liquidity, security and on-chain activity in more detail.
Where Technical and Fundamental Data Overlap
The boundary between TA and FA is not always clean. Some datasets can answer different questions depending on how they are used.
Technical Analysis
Market and positioning data
- Price structure
- Trading volume
- Volatility
- Momentum
- Support and resistance
- Open interest
- Funding rates
- Liquidations
Fundamental Analysis
Asset and network data
- Circulating supply
- Token unlocks
- Users and transactions
- TVL and liquidity
- Fees and revenue
- Development
- Governance
- Security
Trading volume is a simple example of the overlap. A technical trader may use it to judge participation behind a breakout, while a fundamental analyst looking at a DEX may examine sustained volume as evidence of product usage.
Open interest provides a different kind of overlap. It primarily describes derivatives positioning, but a rapid build-up can also help explain why price is moving aggressively even when the underlying project has not changed.
When Technical and Fundamental Signals Disagree
Strong fundamentals, weak chart
Consider a DeFi protocol with growing users, rising fee revenue and manageable token unlocks while its token remains below a long-term moving average and continues to form lower highs.
The project may be improving faster than the market price. The gap could reflect weak conditions across crypto, poor token value capture or a valuation that had already priced in much of the expected growth.
Strong chart, weak fundamentals
A bullish chart can coexist with declining protocol usage, concentrated ownership or a large upcoming token unlock. The price trend can continue despite those weaknesses because market momentum and project fundamentals do not have to change at the same time.
Limitations of Both Approaches
Event risk affects both methods. An exploit, exchange failure, regulatory action or major macroeconomic event can alter the market before it appears in historical chart data, while a sound fundamental thesis can remain unrewarded by price for an extended period.
How to Use Technical and Fundamental Analysis Together
The two methods can be combined without forcing them into the same framework. A practical process has four parts.
1. Define the decision
Decide whether you are evaluating long-term exposure, considering a short-term trade or reviewing a position you already hold. The type of decision determines which information deserves the most weight.
2. Test the asset thesis
Check the fundamentals that actually support the idea. A thesis based on adoption should be tested against usage; one based on limited supply should be checked against emissions and token unlocks.
3. Read the market around the thesis
Use the chart to see whether price structure and momentum support the setup or show persistent weakness. If derivatives activity is significant, funding and open interest can reveal whether positioning has become crowded.
4. Define what would prove the setup wrong
A technical setup might fail if price loses a key structural level. A fundamental thesis might need to be reconsidered after falling usage, accelerating dilution, a security failure or sustained loss of market share.
For active trading, order type and execution also affect the outcome. Our guide to crypto trading basics covers liquidity, orders and execution in more detail.
Which Approach Should You Use?
FA tests whether the asset thesis holds up; TA shows how the market is treating that thesis. Neither needs to be restricted to a particular timeframe or type of investor.
Technical vs. Fundamental Analysis FAQ
Is technical analysis reliable for crypto?
TA can help identify trend, momentum and important price levels, but its signals should be treated as probabilities rather than certainty.
Is fundamental analysis useful for Bitcoin?
Yes. Bitcoin analysis can include issuance, network security, adoption and liquidity rather than the company-style metrics used for stocks.
Can technical analysis be used for long-term investing?
Yes. Weekly and monthly charts can show long-term market structure and major price levels.
What fundamentals should I check before buying an altcoin?
Start with token supply, usage, liquidity, security and the source of demand for the token. The relevant metrics depend on what the project is designed to do.
Should beginners learn technical or fundamental analysis first?
Learn fundamental analysis first if the goal is to understand an asset. If the goal is to trade price movements actively, technical analysis becomes necessary as well.
This article is for educational purposes only and does not constitute financial, investment or trading advice. Cryptocurrency markets are volatile, and no analytical method can guarantee future performance.



With over 6 years of experience in the world of financial markets and cryptocurrencies, Teodor Volkov provides in-depth analyses, up-to-date news, and strategic forecasts for investors and enthusiasts. His professionalism and sense of market trends make the information he shares reliable and valuable for everyone who wants to make informed decisions.