XRP at $1.05: A Calmer Market, but Still a Bearish One

XRP is consolidating after a hard fall, and its derivatives market has quietly gone calm. Price sits at $1.0479 at the time of writing, down 5.6% for the week, having dropped from the $1.25 area through $1 in June.
Key Takeaways
- XRP trades at $1.0479 after a June collapse from $1.25 to a $1.007 low.
- All three moving averages sit above price and are declining.
- Open interest broke structurally lower in October 2025 and stays compressed.
- The turnover ratio at 0.71 points to subdued speculative churn.
Underneath that, leverage and turnover have both thinned out. The combination describes a market that has de-risked, which is not the same as one turning bullish.
The June Collapse and Where Price Sits
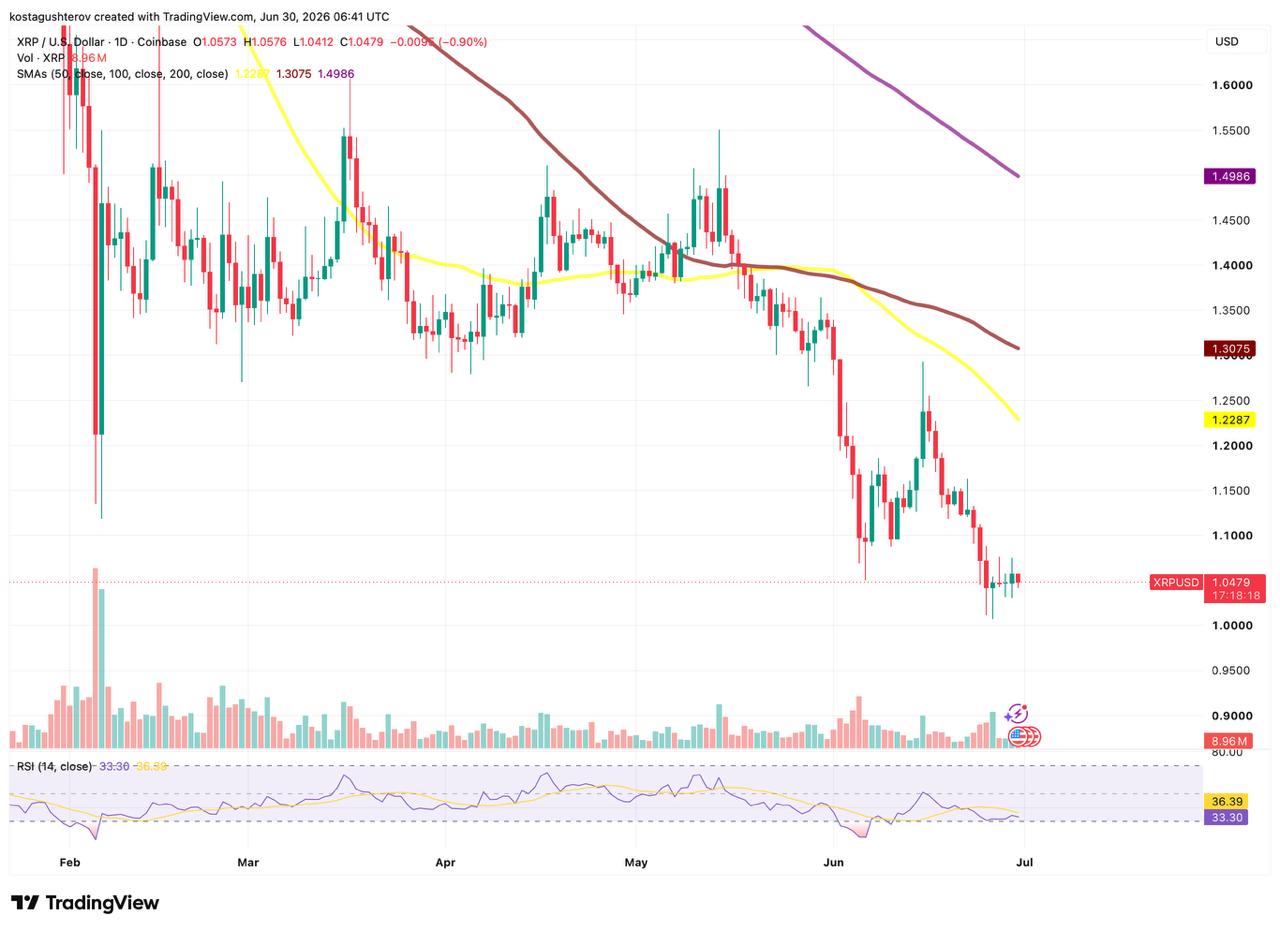
XRP has been in a downtrend since the 2026 hight of $2.4 reached in january, and June was the sharpest leg. The decline came in steps: sharp red candles from $1.30 to $1.16, a mid-month bounce back to $1.30, then a second leg that broke below $1.10 and bottomed at $1.007 on June 26. The last several candles have compressed tightly between $1.04 and $1.07, the first real consolidation after weeks of one-way selling. Volume on the down-legs ran heavier than on the bounce attempts, which says the selling carried more conviction than the recovery bids.
The Structure Is Still Bearish
The moving averages leave no ambiguity on the TradingView chart. The 50-day sits at $1.2287, the 100-day at $1.3075, and the 200-day at $1.4986, all above price, all declining, with the 200-day sloping down most steeply into July. Price is roughly $0.18 below the 50-day and nearly $0.45 below the 200-day, a wide bearish gap with no convergence.
RSI tells the one less-bearish part. It bottomed near an extreme oversold reading around 20 in early June, then recovered to the current 33.30, with the signal line at 36.39. That’s momentum lifting off the low, but still well below the neutral 50 zone, recovered, not reversed.
Open Interest Broke Lower and Stayed There
The derivatives side is where the structural story sits. Open interest shows two clear regimes. From roughly May to September 2025 it ran consistently above 800M and peaked over 1.2B. Then, around October 2025, it broke sharply lower and has stayed compressed in the 300M to 500M range ever since, including the current June 2026 reading.\
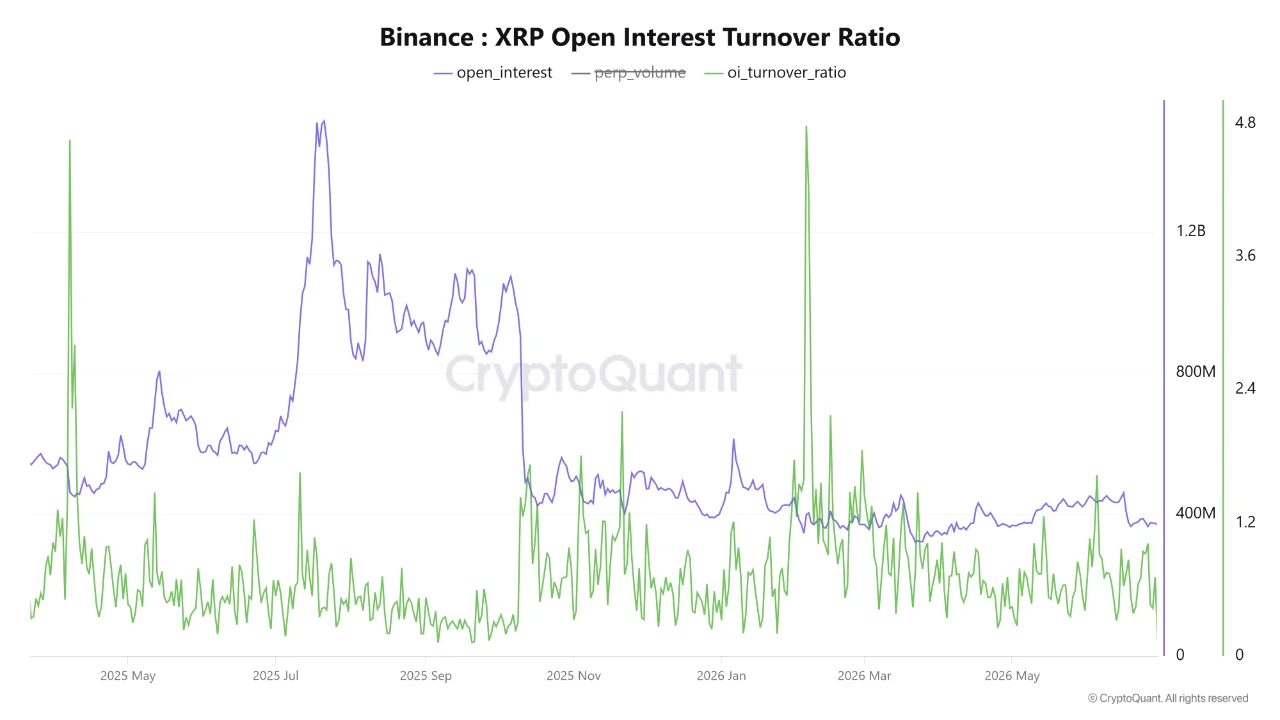
This looks like a permanent regime shift rather than a temporary dip. Current OI sits comfortably inside that lower post-October range, not testing the bottom of it. Less open interest means fewer leveraged bets are on the table than during the mid-2025 peak.
What the 0.71 Turnover Ratio Means
The Open Interest Turnover Ratio is influenced by short-term spikes rather than sustained trends. This indicator measures the ratio of daily futures trading volume to the total open interest (OI) in the market. In practice, it shows how quickly traders’ positions are replaced (“turned over”) within a 24-hour period. A ratio below 1 indicates that capital is more stable and positions are held for longer, while a high ratio signals that market participants are opening and closing their positions extremely aggressively and quickly.
Historically, the XRP market has seen one-day spikes to 4 or higher (as in February 2026), meaning that on those days, the entire available volume of positions was rolled over four times under the pressure of high volatility. Apart from these isolated instances, however, the baseline typically remains below 1.5, which corresponds to the current value of 0.71.
Two things follow. A low, stable turnover ratio alongside compressed OI means reduced speculative churn, fewer fresh leveraged bets, and existing positions turning over less aggressively. And the historical 4+ spikes aren’t predictive on their own, they’re coincident with volatility events that already happened, the same sharp directional candles visible on the price chart. They mark moves, they don’t forecast them.

Put the two sides together. The price chart shows a market that fell hard through June and is now consolidating with RSI recovering off oversold. The derivatives chart shows subdued leverage and low turnover. Together, that’s a market that has been de-risked through the decline: the aggressive positioning of mid-2025 isn’t here anymore, which removes one source of amplified volatility but says nothing about direction on its own. The moving-average structure remains firmly bearish regardless of the calmer derivatives backdrop.
The levels frame the range. Immediate support sits at $1.04, the bottom of the current consolidation, with the $1 psychological level and the $1.007 June low as the floor beneath it, the zone price clawed back above after the selloff. On the upside, $1.07 caps the current range as immediate resistance, and the real test is far higher: the declining 50-day SMA at $1.2287, with $1.30 marking where June’s bounce attempts failed. Reclaiming the 50-day is what it would take to challenge the downtrend; until then, rallies sit below a falling average.
So the accurate read isn’t bullish or bearish from the derivatives, it’s that the amplification mechanism for the next move is currently muted. The signal worth watching is the turnover ratio and open interest rising together. That combination could mark fresh speculative capital entering, the condition that has historically preceded larger directional moves. It isn’t present now. Until it is, the calm in derivatives is just calm, not a setup.

Kosta has reported on cryptocurrency markets and blockchain infrastructure since 2020, bringing over six years of hands-on experience in the crypto industry built through daily tracking of markets, trends, and emerging blockchain developments. Specializing in Bitcoin on-chain analysis, institutional ETF flows, and digital asset price action, his work at Coindoo has been cited by other news agencies and consistently covers market developments with a focus on data-driven reporting across Bitcoin, Ethereum, Solana, and XRP. Over the years, Kosta has contributed to multiple crypto media outlets in different regions, authoring over 6,000 articles across the sector. His reporting spans cryptocurrency markets and the broader fintech industry, tracking not only price action but also the technological and regulatory forces shaping the ecosystem. To support his analysis, Kosta actively leverages on-chain data and metrics from leading platforms such as Santiment, Glassnode, and CryptoQuant, enabling deeper, evidence-based market insights. He believes in the power of transparency and the data that underpins the blockchain ecosystem. His academic background in Marketing Management from Denmark further complements his analytical approach, adding a strong understanding of communication strategy and content positioning to his work.