Chainlink Jumps 6% but Runs Into a Bigger Test

Chainlink’s 6.2% breakout has pushed LINK straight into its toughest resistance in weeks, just as whale activity reached a five-month high.
Key Takeaways
- LINK has finally escaped its late-July range.
- The breakout immediately faces heavier long-term resistance.
- Former resistance now becomes the first support test.
- Whale balance growth adds weight to the move.
LINK’s Breakout Arrived a Day Later
Chainlink barely reacted on August 10 when Standard Chartered published a bullish long-term outlook that put LINK at $13 by the end of 2026 and $200 by 2030. Price remained around $8.22-$8.26, leaving buyers beneath the same technical ceiling that had contained LINK since late July.
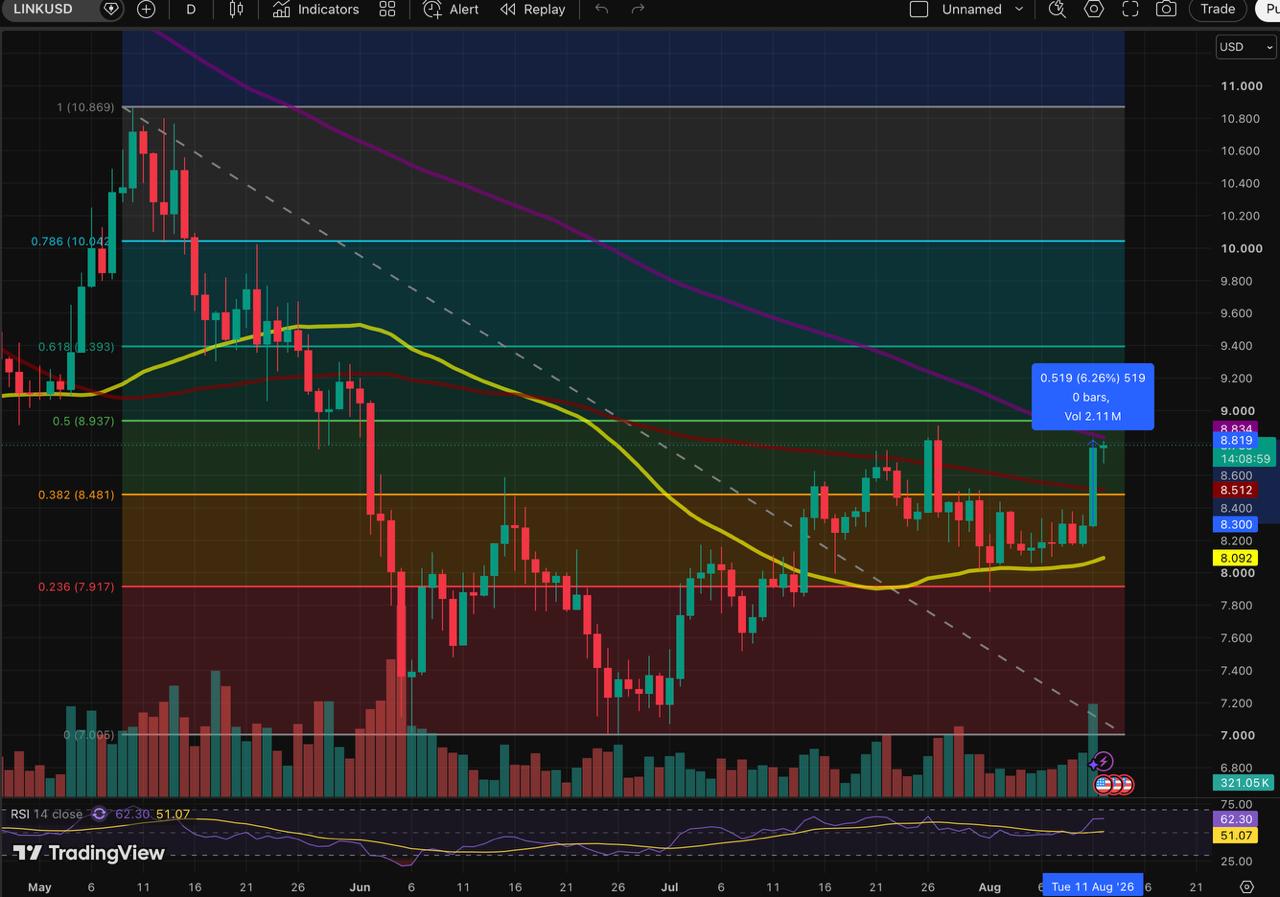
As we noted at the time, the 100-day simple moving average and 0.382 Fibonacci retracement formed the upper boundary of that range. LINK needed to clear both levels to escape and it did.
The move came on August 11. LINK jumped roughly 6.2%, breaking above the 0.382 Fibonacci level at $8.48 and the 100-day SMA near $8.5 before reaching the 200-day SMA.
At the time of writing on August 12, LINK traded around $8.82 on Coinbase, just below the 200-day average at $8.83.
$8.83-$8.94 Is the Next Barrier
The 200-day SMA is only the lower edge of the next resistance area. The 0.5 Fibonacci retracement sits at $8.94, creating a tight $8.83-$8.94 cluster that also overlaps with the area from which LINK’s broader decline began in June.
A brief move above the 200-day average would not be enough on its own. LINK needs to clear the full zone and hold above it rather than push through the moving average only to stall at the Fibonacci level.
Daily RSI has risen to 62.30, above the neutral 50 mark but still below the conventional overbought threshold of 70. The August 11 candle also came with a visible pickup in volume compared with much of the preceding consolidation.
A confirmed move above $8.94 would bring the 0.618 Fibonacci retracement around $9.39 into focus as the next visible resistance.
Rejection from $8.83–$8.94 would be especially important because one 6.2% daily jump has not yet changed LINK’s broader trend. Price already tested the 0.5 Fibonacci retracement around $8.94 on July 26-27 and failed to break through, so today’s recovery can still fade if buyers again lose momentum at the same area.
In that case, $8.48-$8.5 becomes the first support to watch, where the 0.382 Fibonacci level and 100-day SMA converge. Holding that former resistance on a pullback would keep the August 11 breakout intact; falling back below it would return LINK to the old range and strengthen the case that the move was another failed attempt to reverse the broader decline.
LINK Whale Transactions Hit a Five-Month High
Santiment recorded 246 LINK transactions worth at least $100,000 over a 24-hour period, the highest daily count in five months.
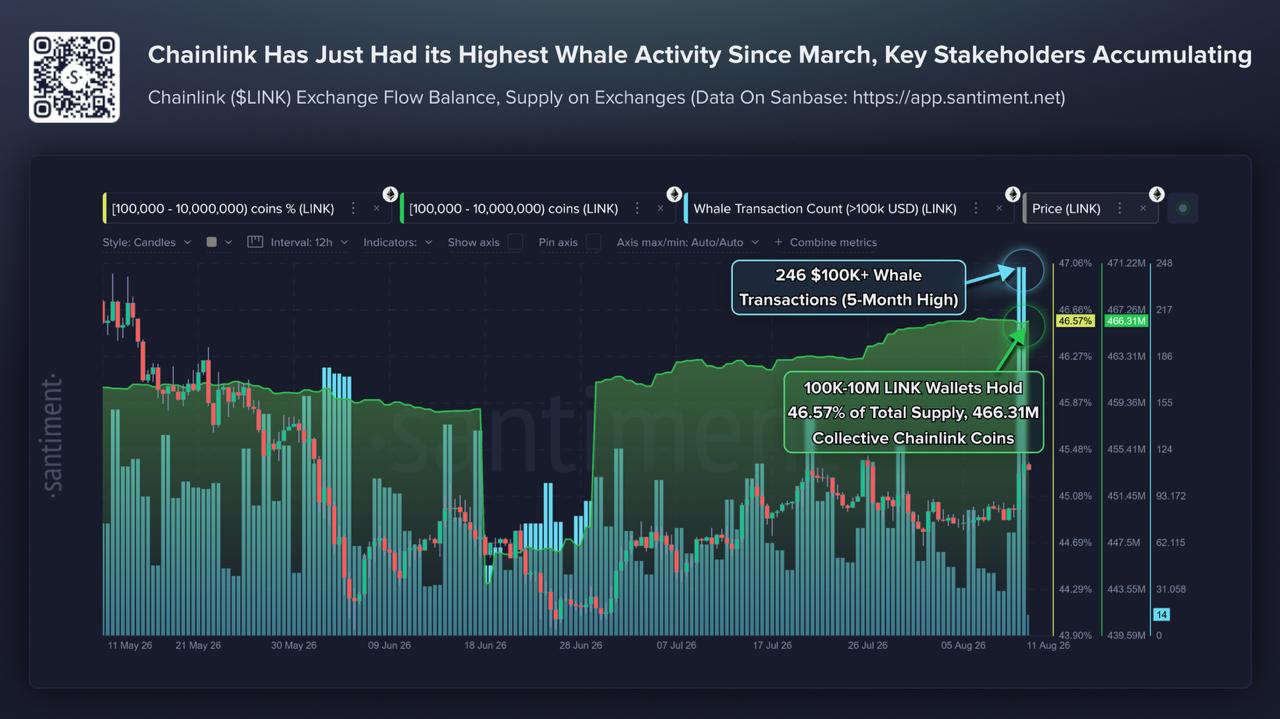
Wallets holding between 100,000 and 10 million LINK controlled 466.3 million tokens, or 46.5% of supply, with Santiment reporting balance growth in the cohort as large transactions hit a five-month high. The transaction spike alone is not directional, but rising balances suggest major holders were adding exposure rather than simply moving tokens around.
That makes the timing more important. LINK broke out of its late-July range just as large-holder activity and balances strengthened, giving the August 11 move more support than price action alone would show. The on-chain signal now meets its technical test at $8.83–$8.94: clearing that zone would turn the whale activity into confirmation of a broader breakout, while another rejection would show that stronger positioning has not yet been enough to push LINK through long-term resistance.
- Disclaimer: This article is for informational and educational purposes only and does not constitute financial or investment advice. Technical levels, whale activity and wallet-balance data can change quickly and do not guarantee future LINK price performance.




Kosta has reported on cryptocurrency markets and blockchain infrastructure since 2020, bringing over six years of hands-on experience in the crypto industry built through daily tracking of markets, trends, and emerging blockchain developments. Specializing in Bitcoin on-chain analysis, institutional ETF flows, and digital asset price action, his work at Coindoo has been cited by other news agencies and consistently covers market developments with a focus on data-driven reporting across Bitcoin, Ethereum, Solana, and XRP. Over the years, Kosta has contributed to multiple crypto media outlets in different regions, authoring over 6,000 articles across the sector. His reporting spans cryptocurrency markets and the broader fintech industry, tracking not only price action but also the technological and regulatory forces shaping the ecosystem. To support his analysis, Kosta actively leverages on-chain data and metrics from leading platforms such as Santiment, Glassnode, and CryptoQuant, enabling deeper, evidence-based market insights. He believes in the power of transparency and the data that underpins the blockchain ecosystem. His academic background in Marketing Management from Denmark further complements his analytical approach, adding a strong understanding of communication strategy and content positioning to his work.