HYPE Price Rebounds Toward Recent Highs After Dip to $60s

Hyperliquid's native token, HYPE, recovered toward the upper end of its recent trading range on June 29, erasing most of a mid-week slide that had pulled it into the low $60s while the wider market softened.
Key takeaways
- HYPE rebounded near $65.74 on June 29, up close to 6%, reclaiming its key moving averages.
- About 99% of protocol fees buy back HYPE, tying demand to platform usage.
- Multicoin’s base case sees $319 by 2028, roughly fivefold upside.
- The bounce came after a softer week, read as a cooldown rather than capital leaving.
The move lifted the token back above its short-term moving averages on the intraday chart and kept it inside the top ten by market value, even though its weekly reading stayed slightly negative following the pullback from the all-time high set earlier in June. The timing was not incidental: the rebound landed in a week when the network kept adding products and drew unusually heavy institutional attention, and that backdrop explains far more than the candle itself does.
How trading activity feeds back into the token
Most of what moves HYPE traces back to a single mechanism. Hyperliquid spends the overwhelming majority of the fees it collects buying HYPE on the open market and removing it from circulation, a share Multicoin Capital put at roughly 99% of protocol revenue. That creates a fairly direct line between usage and price, because more trading produces more fees, larger fee revenue funds bigger repurchases, and those repurchases steadily tighten the available supply. It is also why the story around the token is really a story about how many markets the platform can run, not about any one session’s price action. This week fit the pattern, as Hyperliquid widened the beta of its fee-and-buyback machinery and portfolio-margin system, letting accounts post BTC and HYPE as collateral across perpetuals, spot and prediction markets, while builders such as Felix and Tradexyz extended around-the-clock trading of tokenized equities and stock perpetuals tied to names like Nvidia, Tesla and Qualcomm. Each of those venues is another tap feeding the same engine.
Stablecoin liquidity is the fuel, and it sits near record levels
Beneath the trading sits the network’s stablecoin base, which functions as the system’s working capital. That pool has expanded sharply over the past year, climbing from a little over a $1 billion to close to $6 billion, almost entirely in USDC, according to data from DefiLlama.
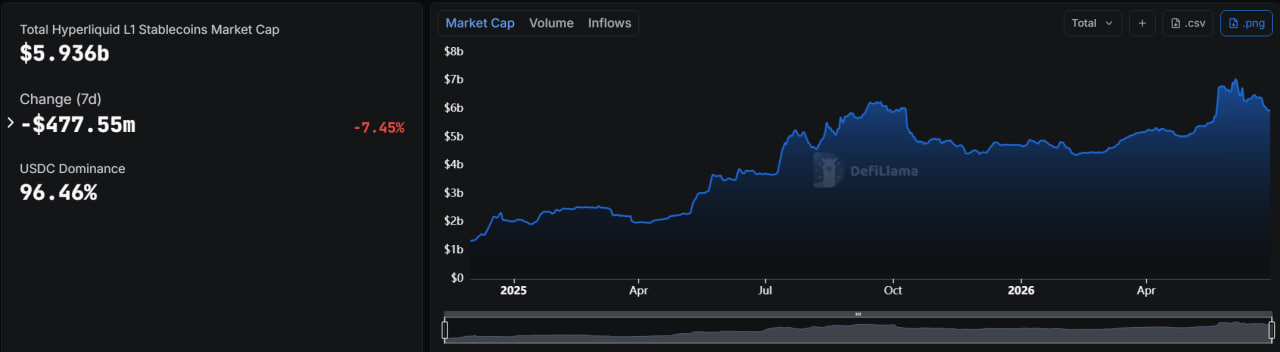
Read against that climb, the modest week-on-week dip looks more like positioning unwinding after a record high than money draining out of the ecosystem. Deeper stablecoin reserves translate into thicker order books, larger positions and more lending, which is why the figure is treated as a rough proxy for the network’s health.
Why each dip keeps getting bought
The same resilience shows up in order flow. Demand has kept stepping back in after every wave of profit-taking over the past two months, with buyers staying narrowly ahead of sellers even through the heavier selling stretches. That repeated absorption is part of why the recent weakness cooled into a pullback rather than deepening into a broader unwind.
Buyers continue to show strength on Hyperliquid.
Over the last 59 days, net order flow remains positive at +$3.35M, with buyers accounting for $78.77M (51%) versus $75.42M (49%) in sell volume.
Despite periods of increased selling pressure, demand has consistently returned,… pic.twitter.com/J4qUuOf66r
— HypedLaunches (@HypedLaunches) June 29, 2026
What Multicoin’s valuation argues, and what it leaves out
Multicoin Capital published a full valuation of HYPE on June 25 and framed Hyperliquid as an emerging “everything exchange” rather than a narrow derivatives venue. It pointed to about $873 million in 2025 revenue on roughly $2.9 trillion in trading volume, alongside a user base that grew from around 301,000 to 923,000 across the year.
| Scenario | 2028 earnings (est.) | HYPE price target |
|---|---|---|
| Bear case | ~$2.73 billion | ~$109 |
| Base case | ~$8 billion | ~$319 |
| Bull case | ~$17.3 billion | ~$689 |
The firm also disclosed it has accumulated HYPE since February and applied a three-day no-trade window after publishing, and it flagged regulation, competition, governance and bad-debt risk alongside a short-term chart it reads as a possible double-top with support near $52.70.
Reading the chart without the jargon
On the 30-minute chart, HYPE spent most of the week boxed in between roughly $60.50 and $65, trading below its three simple moving averages, the 50-period at $62.86, the 100-period at $62.66 and the 200-period at $63.07, all bunched tightly together around $63. That cluster acted as a ceiling until June 29, when the token broke through all three in a single push and ran up to an intraday high near $66.08 before settling around $65.67. When price clears moving averages that have been sitting on top of it, traders generally read it as short-term momentum flipping to the buyers, and the fact that all three sat so close together made that $62.80 to $63.10 band the line worth watching.
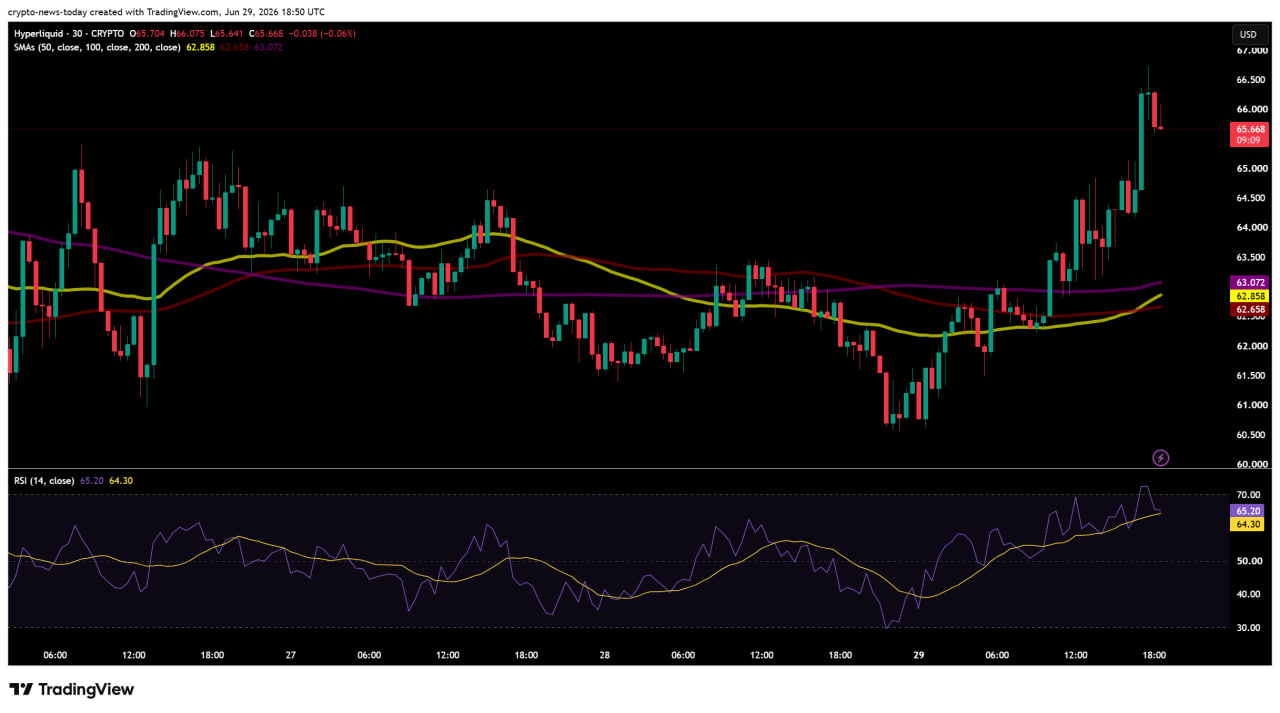
The relative strength index, which measures how stretched a move has become on a scale to 100, climbed to about 65 on the same candle. Readings above 70 are usually treated as overbought, so the bounce still had a little headroom before looking overheated, with the RSI’s own moving average lagging near 64 and confirming the upward turn rather than warning of exhaustion. From here, the first overhead test is the late-June high around $66, which sits just under the record at $76.67, while the reclaimed moving-average band near $63 becomes the first support if buyers lose their grip.
What the expansion changes from here
The common thread is that Hyperliquid’s worth increasingly rests on how many different markets it can host rather than on crypto trading alone. Portfolio margin lets traders run positions more efficiently and tends to lift volume, tokenized equities pull in flow while traditional exchanges are closed, and outside builders add markets the core team never has to operate. All of it routes back through the same fee-and-buyback loop, so ecosystem breadth, rather than a single week’s move, is the variable that compounds over time. The mechanism runs in reverse just as cleanly, since slower volume, a heavy token unlock or stricter regulation would each drain the buyback flow. A HYPE unlock scheduled for early July, releasing close to 1% of supply to contributors, is the next concrete test of whether demand can keep soaking up new tokens.
This article is for informational purposes only and does not constitute financial advice. Consult a professional before making investment decisions.

Alex is Editor-in-Chief of Coindoo and co-founder of Millennial Media Group, with nearly a decade of experience covering financial markets - crypto first, then everything else. It started in 2016 with Bitcoin. Like most people at the time, he didn't fully understand it - so he kept digging. Blockchain, tokenomics, the projects, the cycles. That curiosity never stopped, and eventually pulled him into traditional markets too: equities, commodities, macro. Not because he left crypto behind, but because you can't properly understand one without the other. What drives him is straightforward: he wants to know why something is happening, not just that it's happening. Most market coverage stops at the headline - price up, price down, here's a chart. Alex finds that kind of reporting actively unhelpful. If you walk away from an article without understanding the mechanism behind the move, what did you actually learn? He holds a degree in Tourism from New Bulgarian University - not the most obvious path into financial markets, but markets have a way of pulling in people who are simply too curious to stay out. He has authored over 200 in-depth analyses and more than 10,000 articles across crypto and traditional finance. He still thinks every day in markets teaches him something new. That's probably why he hasn't stopped.