Chainlink Gets $200 Call, but LINK Buyers Barely React

Chainlink has traded in a narrow range since late July, leaving LINK squeezed between two technical clusters on the daily chart.
The 100-day SMA near $8.60 and the 0.382 Fibonacci retracement are blocking price from above, while the 50-day SMA around $8.04 and the 0.236 Fib form the lower boundary. A convincing daily break on either side could give a much clearer signal of whether buyers or sellers are taking control.
Key Takeaways
- LINK remains trapped inside a tightening range, trading for $8.25 at the time of writing.
- The 100-day SMA remains the key ceiling.
- The 50-day SMA anchors the lower boundary.
- The bank’s $200 call sparked little reaction.
- The next daily closes could confirm direction.
Chainlink Is Running Out of Room
For buyers, briefly trading above the upper boundary would not be enough. A daily close through the ceiling would provide much stronger evidence that LINK is escaping the consolidation, especially if price can hold the area on a retest.
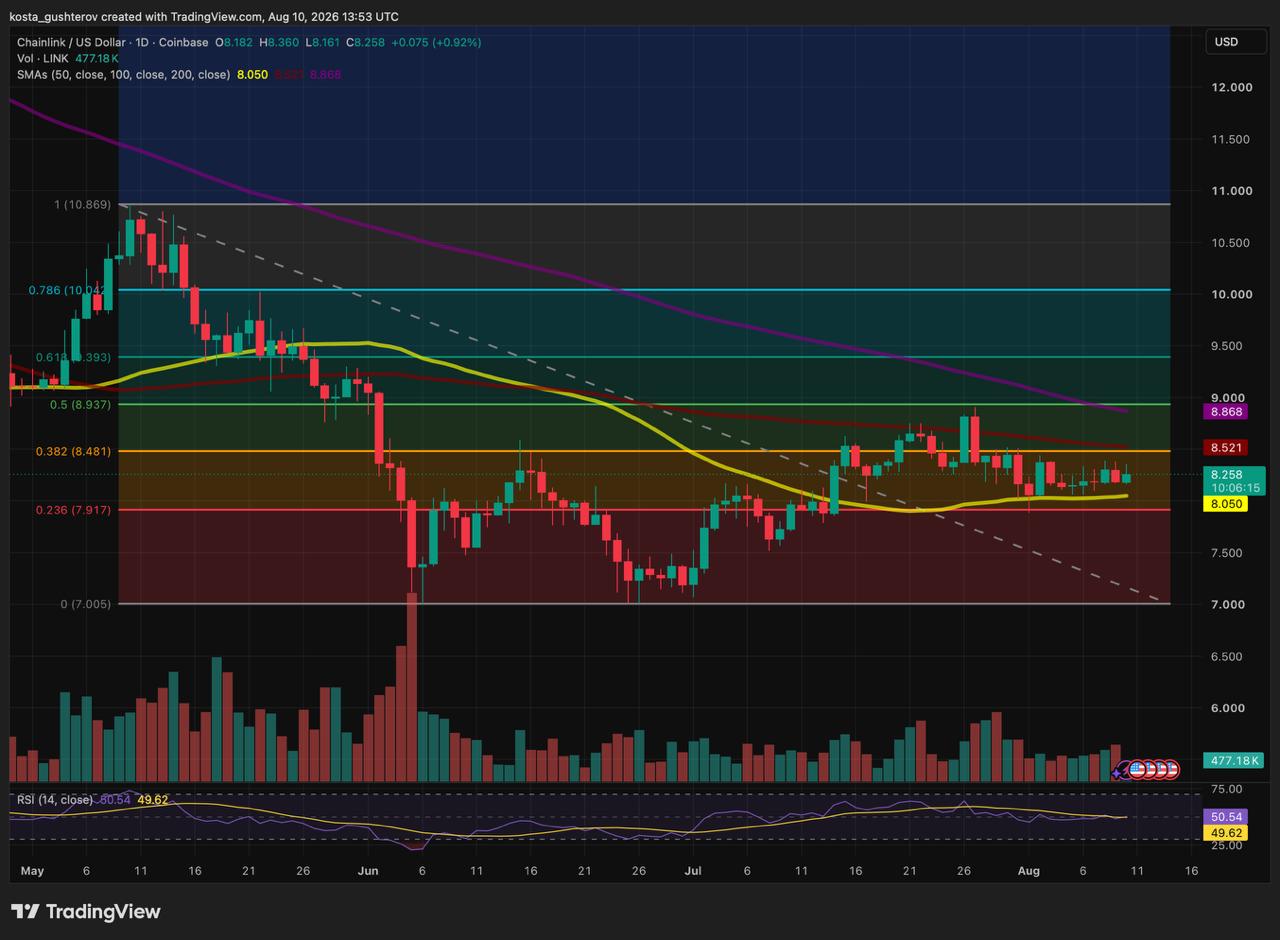
A break below the lower boundary would carry the opposite message. If LINK starts closing underneath the range, the structure that has contained price since late July would begin to weaken and bring the recent lows back into focus.
Price is still caught between those two outcomes, which made Monday’s Standard Chartered report especially well timed.
Standard Chartered Is Betting on Tokenization at Scale
The bank initiated coverage of Chainlink with a $200 price target for the end of 2030, according to report shared by The Block.
That is roughly 24 to 25 times the price LINK was trading at when reports about the research appeared. The bank also set a nearer target of $13 by the end of 2026.
The headline number is aggressive, but the underlying thesis is based on a much larger bet on tokenization.
The bank expects tokenized assets on blockchains to grow from roughly $340 billion today to $4 trillion by the end of 2028. According to the report, Chainlink already secures more than $110 billion in value and accounts for roughly 70% of oracle-dependent DeFi globally.
The argument is that this position becomes considerably more valuable if tokenized funds, securities and other financial assets move onto blockchains at scale. Those markets will need reliable external data and infrastructure capable of connecting assets across different networks, two areas where Chainlink already has a substantial presence.
The valuation model assumes protocol fees could increase roughly 25-fold by 2030, with LINK’s price broadly following that growth.
Reaching that outcome requires institutional tokenization to move beyond pilots, Chainlink to retain a major role in the infrastructure, and higher network activity to translate into stronger demand for LINK itself.
Yet the market response was minimal.
The $200 Call Barely Moved LINK
Reports published Monday showed LINK trading around $8.22 to $8.26, almost exactly where it was when the research began circulating.
That is noticeably weaker than the response around some of the bank’s previous DeFi calls. When it initiated coverage of Morpho with a $60 target, MORPHO jumped more than 13% on the day. Around its $100 Uniswap call, whale transactions reached a seven-month high and active addresses climbed to a four-month high.
The comparison is not one-to-one. LINK, UNI and MORPHO have different liquidity, positioning and market structures. Still, LINK’s lack of movement stands out because the catalyst arrived just as buyers were trying to challenge the upper edge of the range.
The Break That Would Change the Story
The weak reaction does not by itself mean sellers are in control. The more useful signal will come from what price does after failing to capitalize on the headline.
A break above the ceiling would show that buyers eventually found enough demand to resolve the consolidation higher.
A move through the lower boundary would be harder to dismiss. Losing the range immediately after such a bullish research call would suggest that the catalyst was not strong enough to shift short-term demand in buyers’ favor.
The next few daily closes might provide the needed answer.
If buyers finally force a breakout, Monday’s muted response may prove to have been little more than hesitation.
If price breaks lower first, the fact that even a $200 long-term target failed to generate meaningful demand becomes a much more important part of the story.
- Update August 12, 2026
LINK has since broken out of that range, only to reach a tougher resistance cluster around the 200-day SMA and the next Fibonacci level.
- Methodology
The analysis combines daily-chart technical indicators with publicly reported market data and Standard Chartered’s Chainlink research. Price levels are based on moving averages, Fibonacci retracements and daily closes.
- Disclaimer
This article is for informational purposes only and does not constitute financial advice. Crypto markets are highly volatile, and readers should conduct their own research before making investment decisions.



Alex is Editor-in-Chief of Coindoo and co-founder of Millennial Media Group, with nearly a decade of experience covering financial markets - crypto first, then everything else. It started in 2016 with Bitcoin. Like most people at the time, he didn't fully understand it - so he kept digging. Blockchain, tokenomics, the projects, the cycles. That curiosity never stopped, and eventually pulled him into traditional markets too: equities, commodities, macro. Not because he left crypto behind, but because you can't properly understand one without the other. What drives him is straightforward: he wants to know why something is happening, not just that it's happening. Most market coverage stops at the headline - price up, price down, here's a chart. Alex finds that kind of reporting actively unhelpful. If you walk away from an article without understanding the mechanism behind the move, what did you actually learn? He holds a degree in Tourism from New Bulgarian University - not the most obvious path into financial markets, but markets have a way of pulling in people who are simply too curious to stay out. He has authored over 200 in-depth analyses and more than 10,000 articles across crypto and traditional finance. He still thinks every day in markets teaches him something new. That's probably why he hasn't stopped.