XRP Returns to $1 With Its 2026 Low at Risk

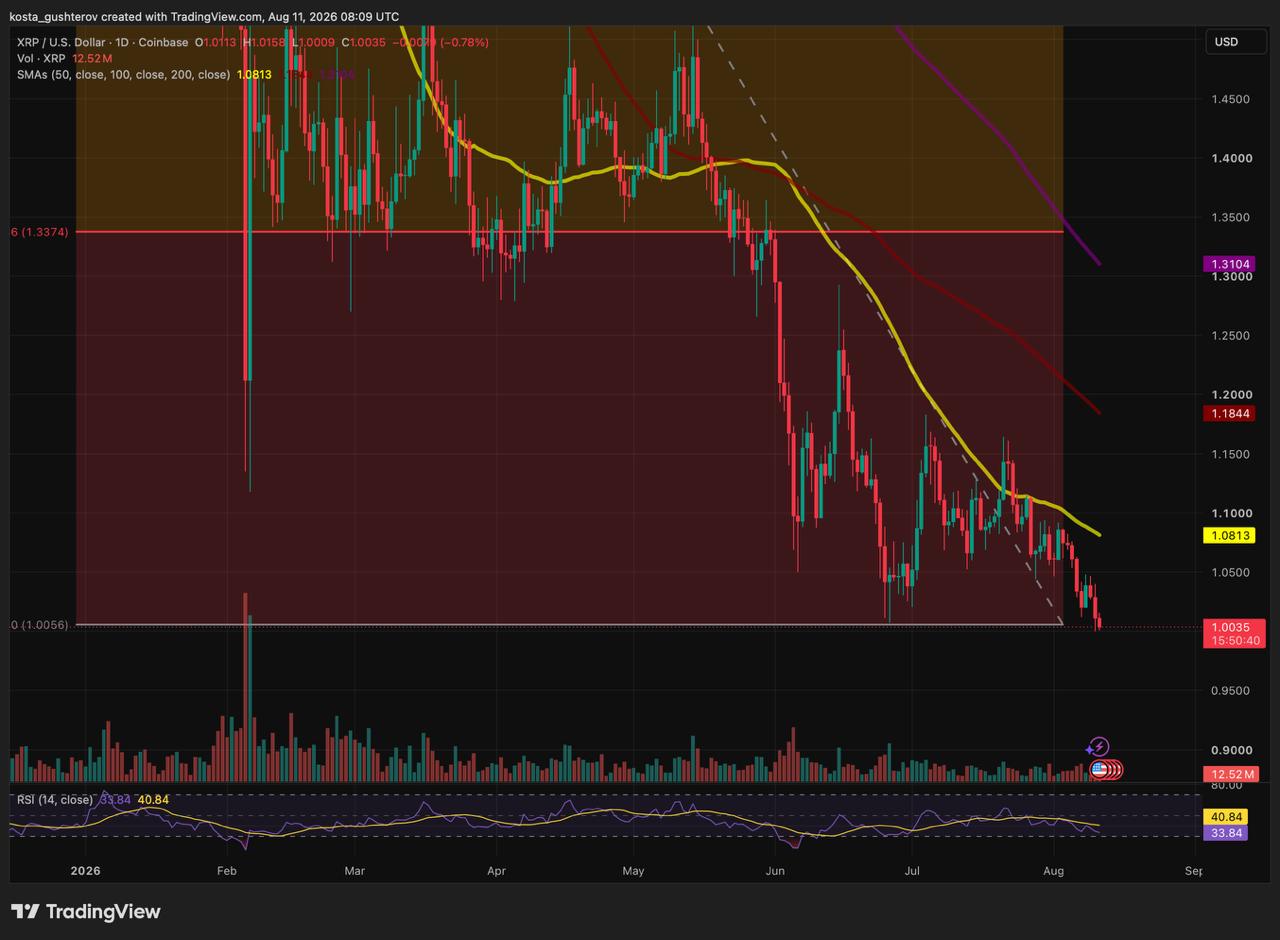
XRP has returned to the area that marked its 2026 low. The token slipped to roughly $1 on August 10, marginally below the June 26 bottom near $1.01 and its weakest level since mid-November 2024. An initial recovery toward $1.02 faded quickly, with XRP back near $1.0038 on August 11.
Key Takeaways
- XRP is testing whether its yearly bottom can survive.
- Spot and futures flows still favor sellers.
- Long liquidations are adding to the decline.
- Bulls still need a broader technical recovery.
XRP Is Testing Its 2026 Low
The June low near $1.01 had held as XRP’s lowest point of the year until this week’s move briefly pushed beneath it.
A wick below $1 would not settle the question. A sustained move under the level would carry much more weight, with the next visible support sitting around $0.93.
The daily RSI is down to 33.9 but has not yet crossed below 30. XRP is approaching oversold territory, though the indicator still leaves room for sellers to press further.
The 50-Day SMA Is the First Repair Target
The damage is also visible higher on the chart.
XRP has broken below the rising trend line that supported the June-July recovery and remains under the 50-day SMA, now around $1.081. The moving average itself has started turning lower.
Holding the current low would stop the immediate decline from extending, but it would not repair the chart on its own. A move back above the 50-day SMA would be a stronger sign that buyers are regaining some of the ground lost during the selloff.
The order-flow data helps explain why that recovery has been difficult so far: active selling remains stronger in both spot and derivatives markets.
Spot Flows Still Lean Toward Sellers
CoinGlass data shows negative XRP spot flow across every window in the snapshot.
Over 24 hours, inflows totaled $66.65 million against $76.17 million in outflows, leaving net flow at -$9.52 million. The imbalance reaches -$19.96 million over three days, -$32.26 million over five days and -$47.19 million over seven days.
XRP is therefore testing major support without a clear pickup in aggressive spot demand. The imbalance is considerably larger in derivatives.
A Long Flush Is Adding to the Selloff
XRP futures recorded net flow of -$78.63 million over 24 hours, widening to -$98.94 million over three days, -$163.03 million over five days and -$261.97 million over seven days.
At 03:00 on August 11, when XRP was near $1.0039, CoinGlass recorded about $2.11 million in long liquidations against only $56,850 in shorts.
The skew confirms that a long flush was underway as XRP pressed into support. It does not account for the entire multi-day futures imbalance, but forced exits are clearly adding to the selloff rather than the move coming only from traders opening fresh shorts.
If $1 gives way while that deleveraging continues, forced selling could accelerate the breakdown.

Funding Has Not Fully Reset
Despite the long-liquidation spike, XRP’s open-interest-weighted funding rate was still positive at 0.0045% in the same snapshot.
Some long bias therefore remained in the perpetual market even after leveraged buyers had already taken losses.
Funding can change quickly during a sharp move, so a single reading should not be stretched too far. But if it remains positive during another move lower, there could still be vulnerable long exposure left to unwind.
A cooler funding rate while buyers hold the current support would offer a healthier sign that some of the excess leverage has been cleared without triggering another leg down.
$1 Separates the Two Scenarios
XRP is now sitting at the point where the decline either stabilizes or starts damaging the year’s broader price setup.
A confirmed break below $1 would remove the support that stopped the June selloff. That risk is reinforced by negative spot flows, heavier futures selling and a liquidation skew that has already punished leveraged longs.
A successful defense would keep the yearly low intact, but buyers would still need to recover the technical ground lost during the decline before the chart starts looking healthier.
For now, the burden is on buyers. Holding $1 keeps the recovery case alive; losing it would leave sellers in control.
- Disclaimer: This article is for informational purposes only and does not constitute financial or investment advice. Cryptocurrency markets are highly volatile, and readers should conduct their own research before making any investment decisions.



Alexander Zdravkov is a market analyst and crypto journalist with interests in economics, broader financial markets and digital assets. His journey into crypto began more than four years ago, driven by a fascination with the rapid evolution of blockchain technology and the transformative potential of decentralized finance. He began analyzing market cycles and identifying emerging trends before they reach the mainstream. He holds a degree in International Relations - a background that helped shape his broader perspective on global economics, geopolitics, and the interconnected nature of modern financial markets. Whether covering the latest developments in the crypto sector or exploring broader macroeconomic themes, Alexander focuses on giving readers context rather than simply repeating headlines. During his career, he has authored more than 5,000 articles covering cryptocurrencies, traditional finance, and global market developments. His work spans everything from Bitcoin and altcoins to macroeconomic trends influencing risk assets worldwide.