11M BTC Are Underwater, but No One’s Selling: Here’s Why

Two record-breaking data points are sitting side by side in Bitcoin's on-chain data right now, and together they describe an unusual market.
Key Takeaways
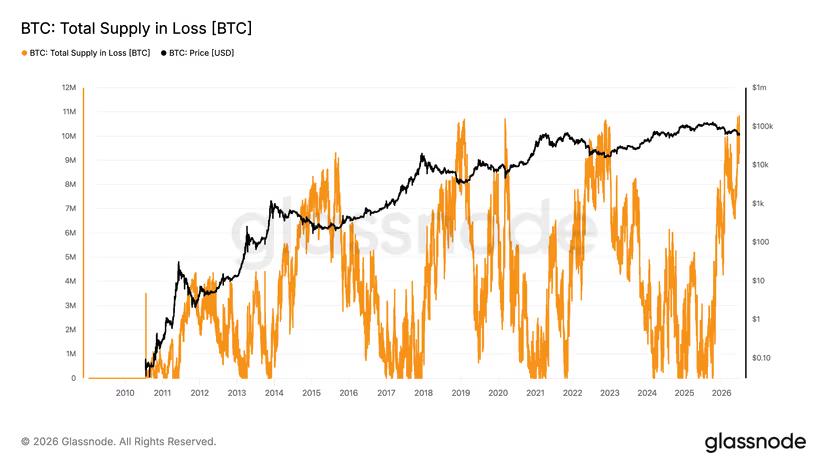
- Nearly 11M BTC are held at a loss, an all-time record.
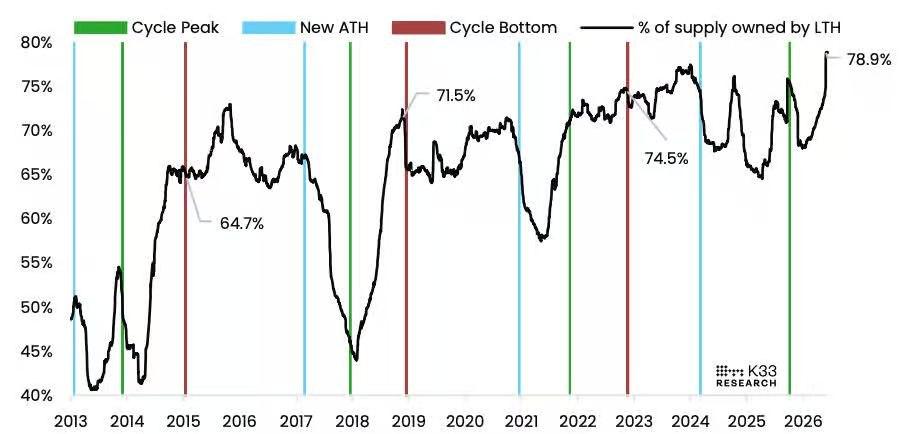
- Long-term holders now control 78.9% of supply, also a record.
- Coins going underwater are being held, not sold.
Nearly 11 million BTC are held at a loss, the most in Bitcoin’s history, more underwater coins than at the 2018 or 2022 bottoms. At the same time, 78.9% of all circulating Bitcoin is held by long-term holders, also a record.
The Paradox
In past cycles, when the supply held at a loss hit extremes, it came with panic selling, weak hands capitulating into the market. That isn’t happening this time. The long-term holder data shows the opposite: accumulation is accelerating, not distribution. Coins falling into loss aren’t being dumped, they’re being held or quietly absorbed by patient capital.
The 78.9% long-term holder figure dwarfs every prior peak. The previous highs were 74.5% in the 2022-2023 bottom zone and 71.5% in 2018-2019. Today’s reading clears both by a wide margin, and it’s still climbing. So the coins going underwater aren’t triggering a wave of selling, they’re being locked away.
The reason could be conviction. These long-term holders, by definition, have weathered drawdowns before, and a coin sitting at a paper loss only becomes a realized loss if it’s sold. For holders who acquired with a multi-year horizon and expect higher prices in the next cycle, an underwater position is a reason to wait, not to capitulate, which is exactly what the rising long-term-holder share might reflects.

What the Pattern Has Meant Before
The historical sequence is consistent. Every time long-term holder supply peaked near or after a cycle bottom, it preceded a new all-time high and then an eventual cycle top, the same pattern played out in 2015, 2018-2019, and 2022-2023. The current 78.9% reading is the highest ever recorded, and it’s spiking rather than flattening, which in prior cycles marked the late accumulation phase before distribution began again.
One thing keeps the record honest. The absolute number of coins in loss depends on how many coins exist and what was paid for them. With circulating supply near 20.04 million and a large share acquired during the 2024-2025 bull run at prices between $60K and $125K, the record 11 million coins in loss is partly a mathematical result of a bigger supply base bought at higher prices. The pain is real, but the record isn’t purely a depth-of-market signal, it also reflects how many people participated in the last bull run.
An unprecedented number of coins held at a loss, owned by an unprecedented share of long-term holders who aren’t selling. That points in one of two directions. Either it’s the setup for the deepest capitulation in Bitcoin’s history, if those conviction holders eventually break, or it’s the tightest supply compression ever recorded heading into the next cycle, if they don’t.

Kosta has reported on cryptocurrency markets and blockchain infrastructure since 2020, bringing over six years of hands-on experience in the crypto industry built through daily tracking of markets, trends, and emerging blockchain developments. Specializing in Bitcoin on-chain analysis, institutional ETF flows, and digital asset price action, his work at Coindoo has been cited by other news agencies and consistently covers market developments with a focus on data-driven reporting across Bitcoin, Ethereum, Solana, and XRP. Over the years, Kosta has contributed to multiple crypto media outlets in different regions, authoring over 6,000 articles across the sector. His reporting spans cryptocurrency markets and the broader fintech industry, tracking not only price action but also the technological and regulatory forces shaping the ecosystem. To support his analysis, Kosta actively leverages on-chain data and metrics from leading platforms such as Santiment, Glassnode, and CryptoQuant, enabling deeper, evidence-based market insights. He believes in the power of transparency and the data that underpins the blockchain ecosystem. His academic background in Marketing Management from Denmark further complements his analytical approach, adding a strong understanding of communication strategy and content positioning to his work.