Bitcoin’s 15-Year Supply Trendline Breaks: What the Data Reveals

Bitcoin is trading around $62,300, and four separate datasets are telling a single, unusual story. One long-running on-chain metric has just broken a floor that held for 15 years, and the flow data underneath it shows two groups of holders moving in opposite directions.
Key Takeaways
- Bitcoin supply in profit sits at 10.2M BTC with price near $300.
- That reading has broken below a multi-cycle trendline that held since 2011.
- All three major SMAs sit far above price, a bearish configuration.
- ETF flows show institutional retreat while exchange supply keeps falling.
- Coins are leaving exchanges into storage even as price drops.
Start with supply in profit, the number of coins held above their acquisition price, currently 10.2 million BTC according to report, shared by CryptoQuant. On its own that figure means little, so the chart gives it 15 years of context. An ascending trendline drawn from 2011 yearend connects the supply-in-profit lows of every major bear market: 2011, 2014-15, 2018, and 2022. Each time Bitcoin crashed, supply in profit dropped hard but held at or above that rising line before recovering. The floor kept climbing because total circulating supply grows every cycle, so even at equivalent pain, more coins exist that were bought at lower prices.
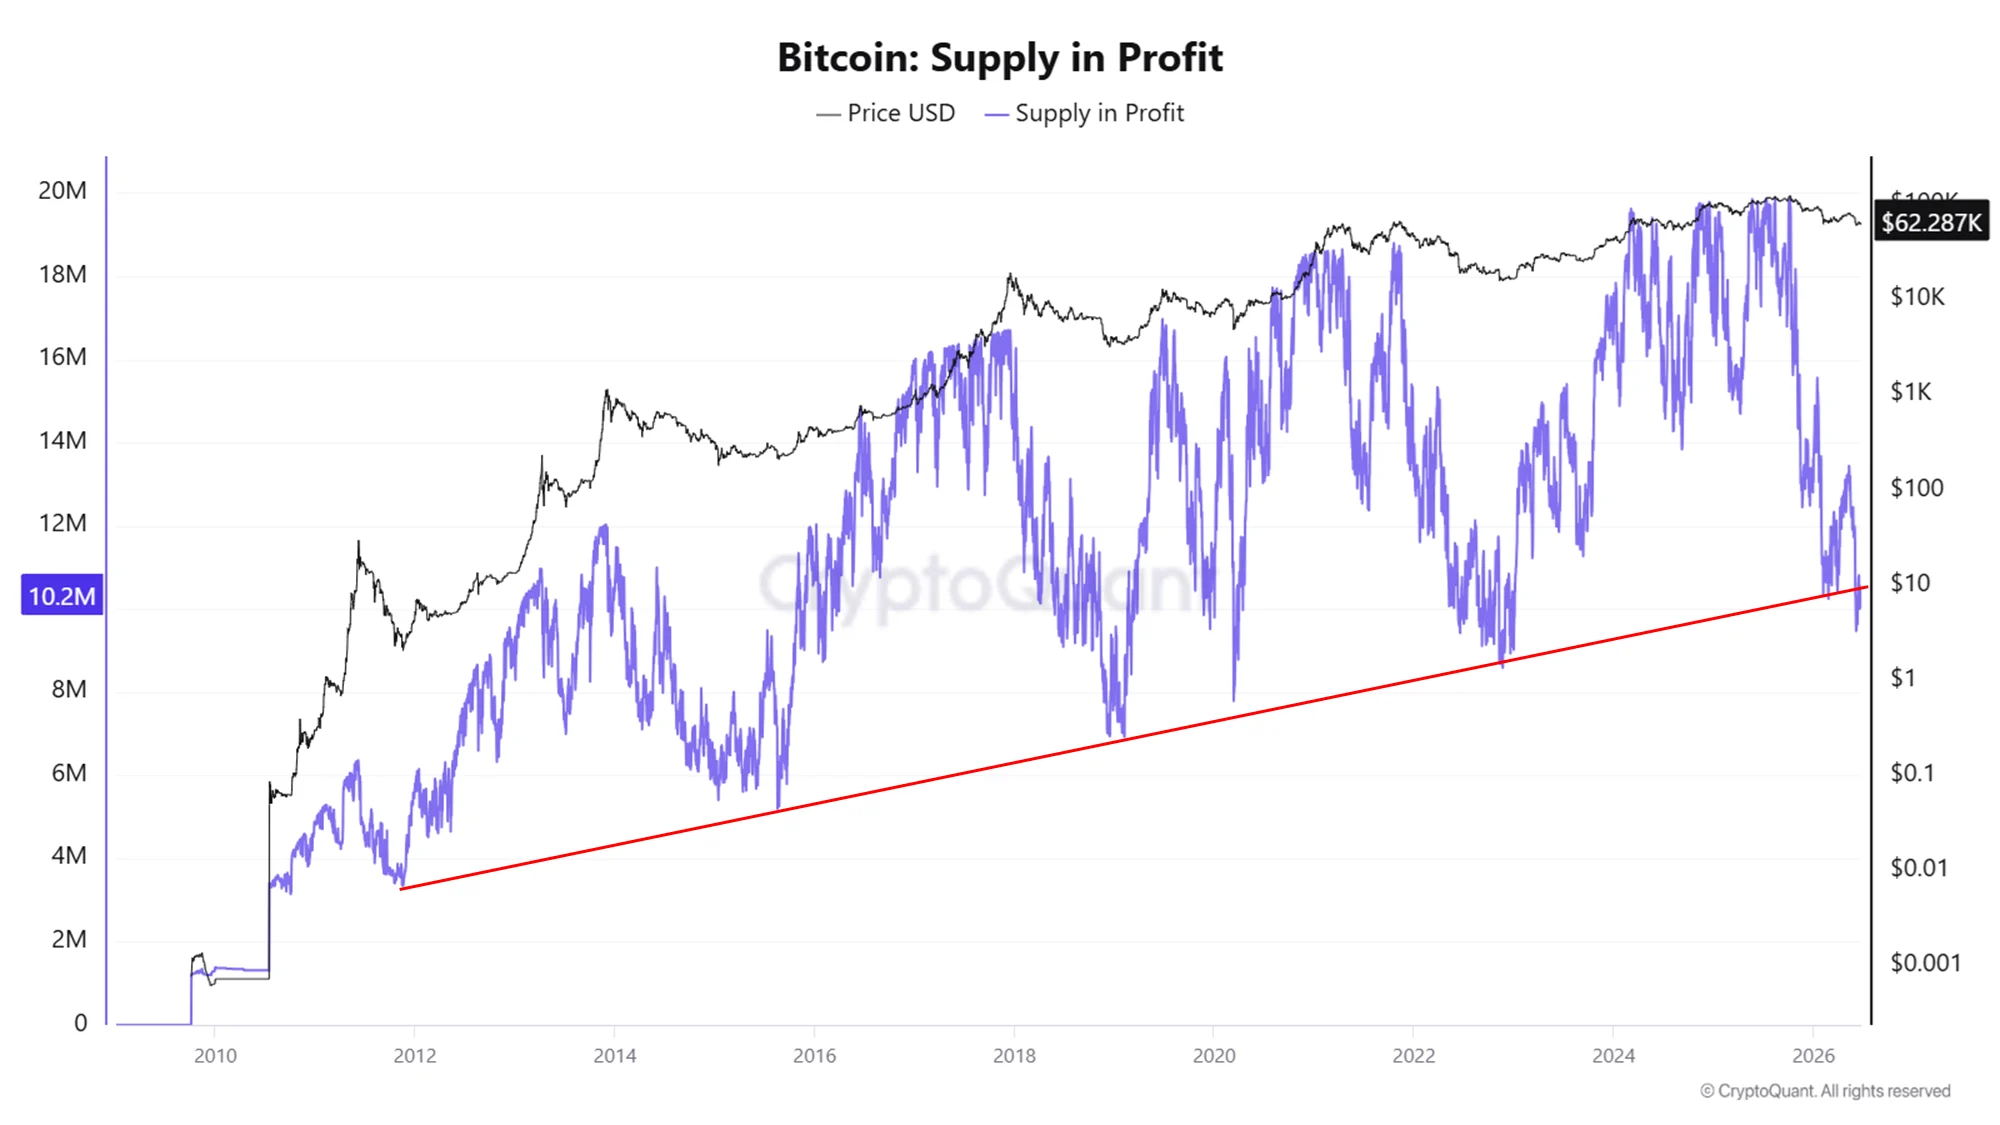
What is different now is simple and significant: the current 10.2M reading has pierced below that trendline. Every prior cycle bottom kissed the line and bounced. This one broke through it. That is the anomaly, not just that supply in profit is low, but that it is lower than the historical floor would predict given the price and the size of today’s supply base.
What 10.2 Million Coins Actually Means
Context sharpens it further. Total circulating Bitcoin is roughly 20 million, so about 10.2 million coins are in profit at $62K, just over half of all supply, while the other 9.8 million are now held at a loss. That’s a sharp reversal from the euphoria of the $100K-plus highs. Prior bear-market bottoms saw supply in profit fall to similar absolute numbers, but on a much smaller total supply base, which makes the percentage of supply underwater right now higher than the raw figure suggests.
For perspective, supply in profit peaked near 19-20 million in late 2024 and early 2025 when Bitcoin traded above $100K, the euphoria zone where almost every holder was green. The slide to 10.2M reflects how much of that supply has fallen back into loss as price dropped from $125K to $62K.
The Price Picture Is Weak
The TradingView daily chart is a headache for bulls right now. Bitcoin opened the day at $63,950, fell to $61,862, and trades around $62,366, down 2.48%. All three major moving averages sit stacked well above price: the 50-day at $71,457, the 100-day at $72,127, and the 200-day at $76,450.
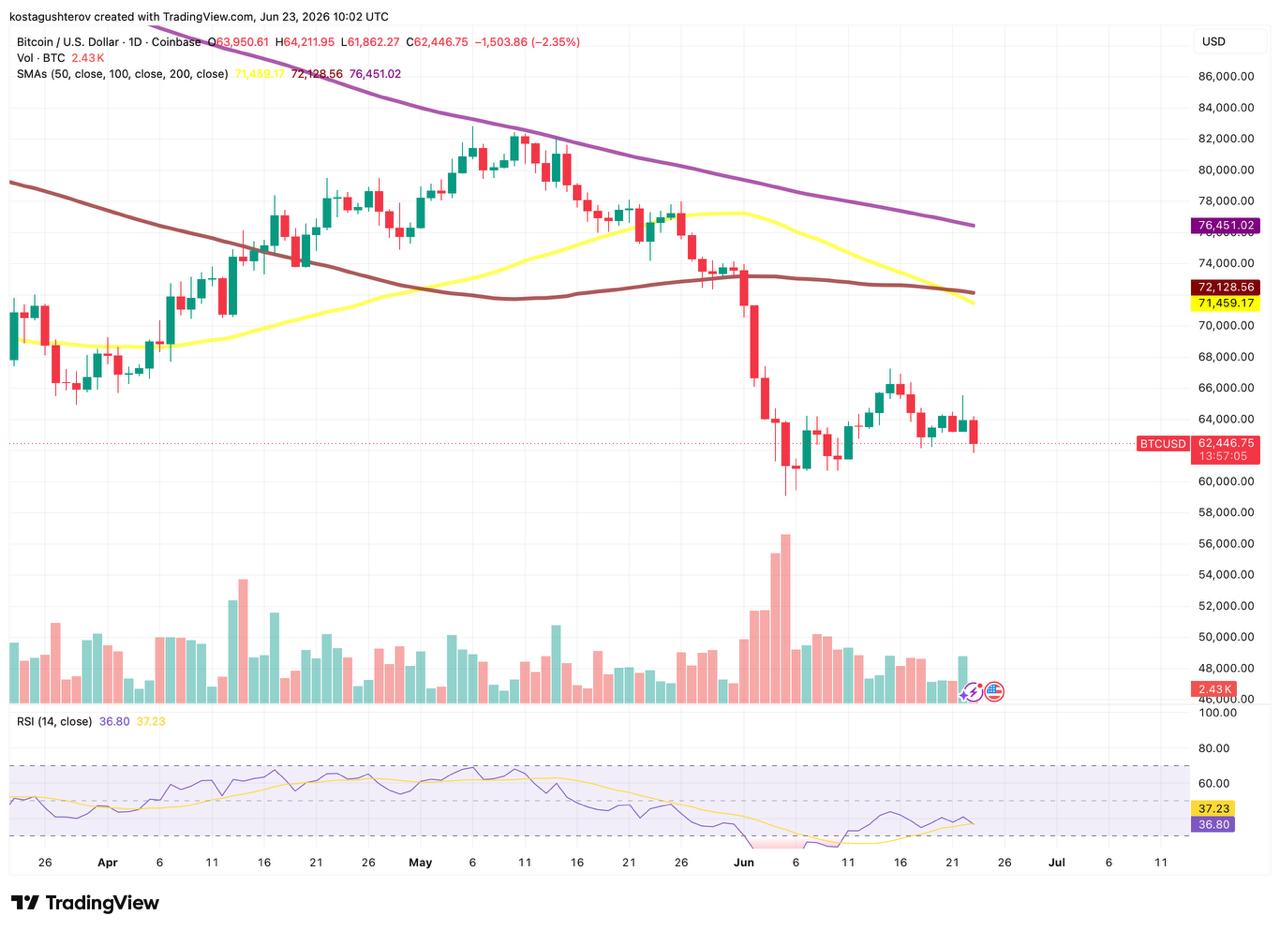
Price is roughly $9,000 below even the nearest average, with no SMA support anywhere close. RSI at 36.60 is approaching oversold without yet triggering a bounce, and today’s candle is retesting the lows set during the sharp June 3-5 selloff.
ETF Flows: Institutions Are Leaving
The regulated-money picture confirms the weakness. Of the 12 trading days according to SoSoValue data, only three posted net inflows: June 4 ($3.05M), June 12 ($85.85M), and June 16 ($10.06M). Every other session was a net outflow. The worst single day was June 5 at -$325.69M, lining up with the price capitulation on the chart, and the most recent reading, June 22, was -$68.18M. There is no inflow trend forming. The green days are isolated and small against the red ones. Through the ETF channel, institutional money is leaving, not accumulating.

The Metric That Ties It Together
The exchange supply ratio is the most structurally telling of the set, and it cuts against the ETF story. The ratio measures the share of total BTC supply sitting on exchanges, and it currently reads 0.133, near the lowest on the entire chart back to May 2023. It peaked around 0.165-0.166 in late 2023 and early 2024 and has fallen almost continuously since, with the decline accelerating from mid-2025 as price slid from $125K to $62K.
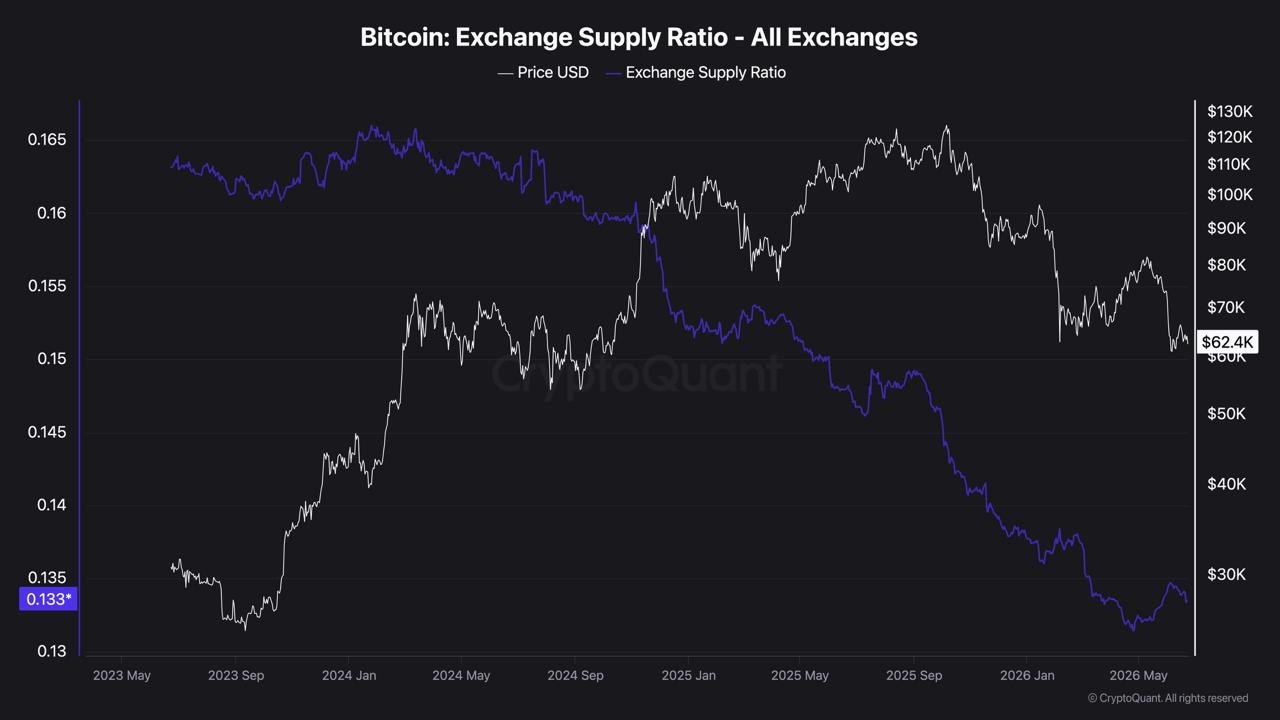
That combination is the key. Price is falling and exchange supply is falling at the same time. Coins are leaving exchanges during a drawdown, which is not panic selling into exchanges, it is withdrawal into cold storage. That directly contradicts what the ETF outflows imply about sentiment, and it lines up with the accumulation read from the supply-in-profit picture.
The Unified Read
Put it together and you get a market with two holder classes moving in opposite directions at $62K. ETF holders are selling, the redemptions are steady and the inflow days are token. At the same time, coins pulled off exchanges are probably going into storage, not back into selling pressure, which could mean that whoever is absorbing this supply is taking it offline immediately.
Of course there is another reading of the situation. When we say “cold storage,” we assume the investor has a long-term horizon (HODL). However, if those coins are moving into DeFi or OTC desks, it actually means they remain “active” and ready to be sold at a certain price. If exchange outflows are massive, but we simultaneously see a spike in DeFi protocol activity, it may suggest a search for yield rather than pure long-term accumulation.
The technical picture is weak, RSI near oversold, price well below all three SMAs with no support nearby, while the on-chain structure quietly tightens.
Still the chart shows the trendline broke; it does not show whether that break is a genuine structural failure or a temporary undershoot before recovery. It cannot tell you who holds those 10.2 million coins, or whether this level marks capitulation or just a pause before more downside. What it does show, clearly, is a divergence: regulated money stepping back while on-chain holders pull supply into cold storage. Which of those two forces wins from here is the one thing the data cannot yet answer.

Kosta has reported on cryptocurrency markets and blockchain infrastructure since 2020, bringing over six years of hands-on experience in the crypto industry built through daily tracking of markets, trends, and emerging blockchain developments. Specializing in Bitcoin on-chain analysis, institutional ETF flows, and digital asset price action, his work at Coindoo has been cited by other news agencies and consistently covers market developments with a focus on data-driven reporting across Bitcoin, Ethereum, Solana, and XRP. Over the years, Kosta has contributed to multiple crypto media outlets in different regions, authoring over 6,000 articles across the sector. His reporting spans cryptocurrency markets and the broader fintech industry, tracking not only price action but also the technological and regulatory forces shaping the ecosystem. To support his analysis, Kosta actively leverages on-chain data and metrics from leading platforms such as Santiment, Glassnode, and CryptoQuant, enabling deeper, evidence-based market insights. He believes in the power of transparency and the data that underpins the blockchain ecosystem. His academic background in Marketing Management from Denmark further complements his analytical approach, adding a strong understanding of communication strategy and content positioning to his work.