Bitcoin Faces Breakout Test as Old Coins Reawaken

Bitcoin traded near $63,900 on August 4 after reclaiming its 50-day simple moving average at approximately $63,250.
The recovery has now reached a crowded area containing the upper boundary of the descending channel, the 0.236 Fibonacci retracement near $63,500 and horizontal resistance around $64,300.
That leaves BTC above short-term support but without a confirmed break from the decline that began in late July.
Key Takeaways
- Bitcoin is pressing into resistance created by a descending channel and the $64,300 area.
- BTC remains above its 50-day SMA, while a rejection could return price toward $62,000.
- Michaël van de Poppe sees $85,000 near the 50-week moving average as a broader recovery target.
- Long-term holder supply has started declining after reaching a record high.
- The onchain shift becomes constructive only if demand absorbs the older coins being moved.
Bitcoin Is Testing a Crowded Resistance Zone
The latest move above the 50-day SMA has improved Bitcoin’s short-term position, but price is still pressing against the descending trendline and the horizontal barrier immediately above it.
A daily close through the channel and $64,300 would remove the first obstacle and bring $65,000 back into view. A later pullback that remains above the broken trendline would provide better evidence that the move was more than another intraday test.
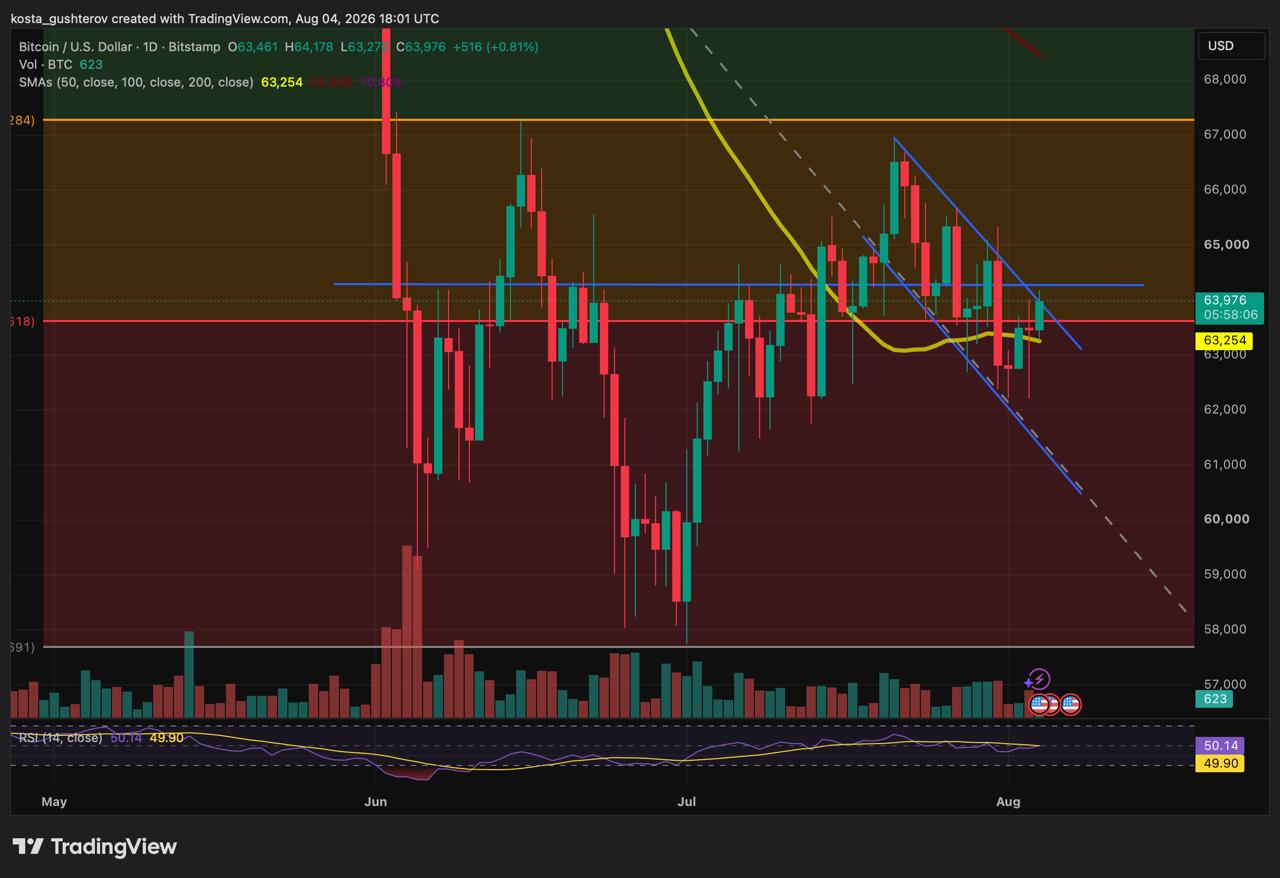
Daily RSI stood near 50, reflecting the same uncertainty visible in price. Momentum has recovered from its recent weakness but has not shifted decisively in favor of buyers.
If the resistance holds, the 50-day SMA near $63,250 becomes the first area to monitor. A deeper reversal would expose the recent support zone around $62,000.
Van de Poppe’s $85,000 Target Is a Broader Weekly Call
If Bitcoin continues above its current resistance, analyst Michaël van de Poppe expects the recovery to extend considerably further.
In an August 4 market update, he wrote:
“The next leg upwards for Bitcoin will be to the $85,000 area.”
Van de Poppe identified the 50-week moving average as the main hurdle near that level.
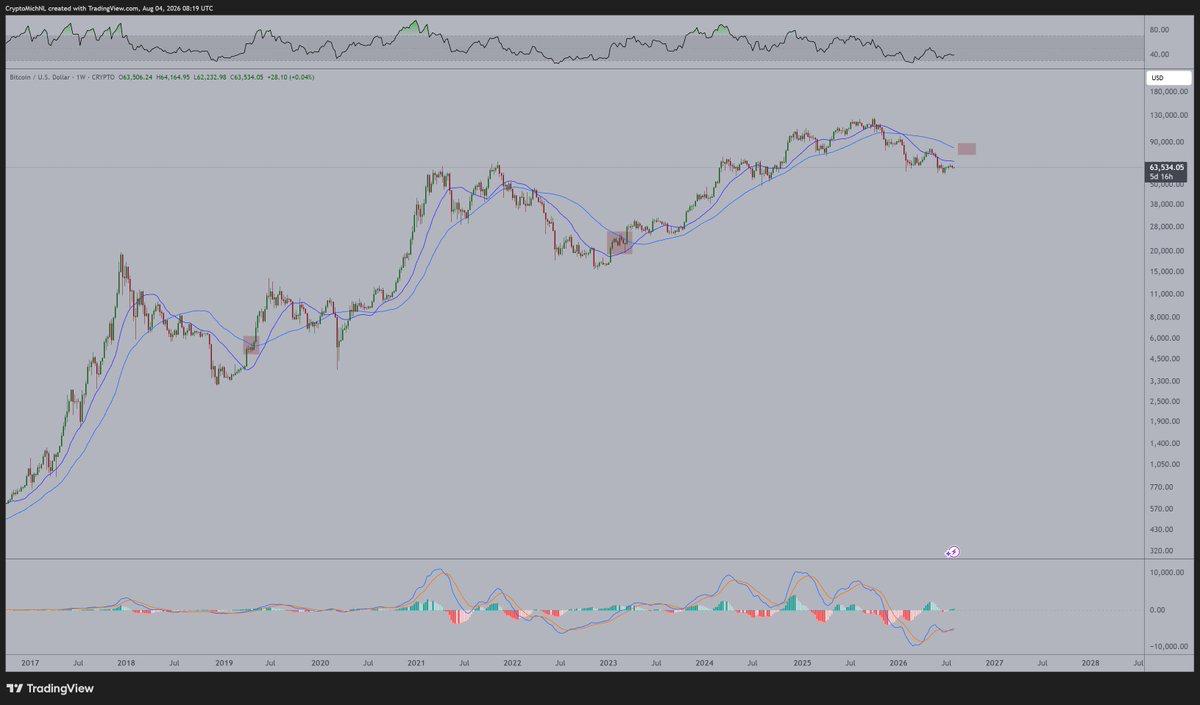
His forecast operates on a wider timeframe than the current daily setup. Bitcoin still faces its 100-day SMA near $68,466 and its 200-day SMA around $70,809 before $85,000 becomes an immediate technical test.
The current breakout attempt would therefore be the first step in that recovery path rather than confirmation that Bitcoin is already heading directly toward Van de Poppe’s target.
Long-Term Holder Supply Has Started to Decline
The technical test is developing as older Bitcoin begins moving again.
A CryptoQuant analysis shows that supply attributed to long-term holders recently turned lower after reaching its highest level on record.
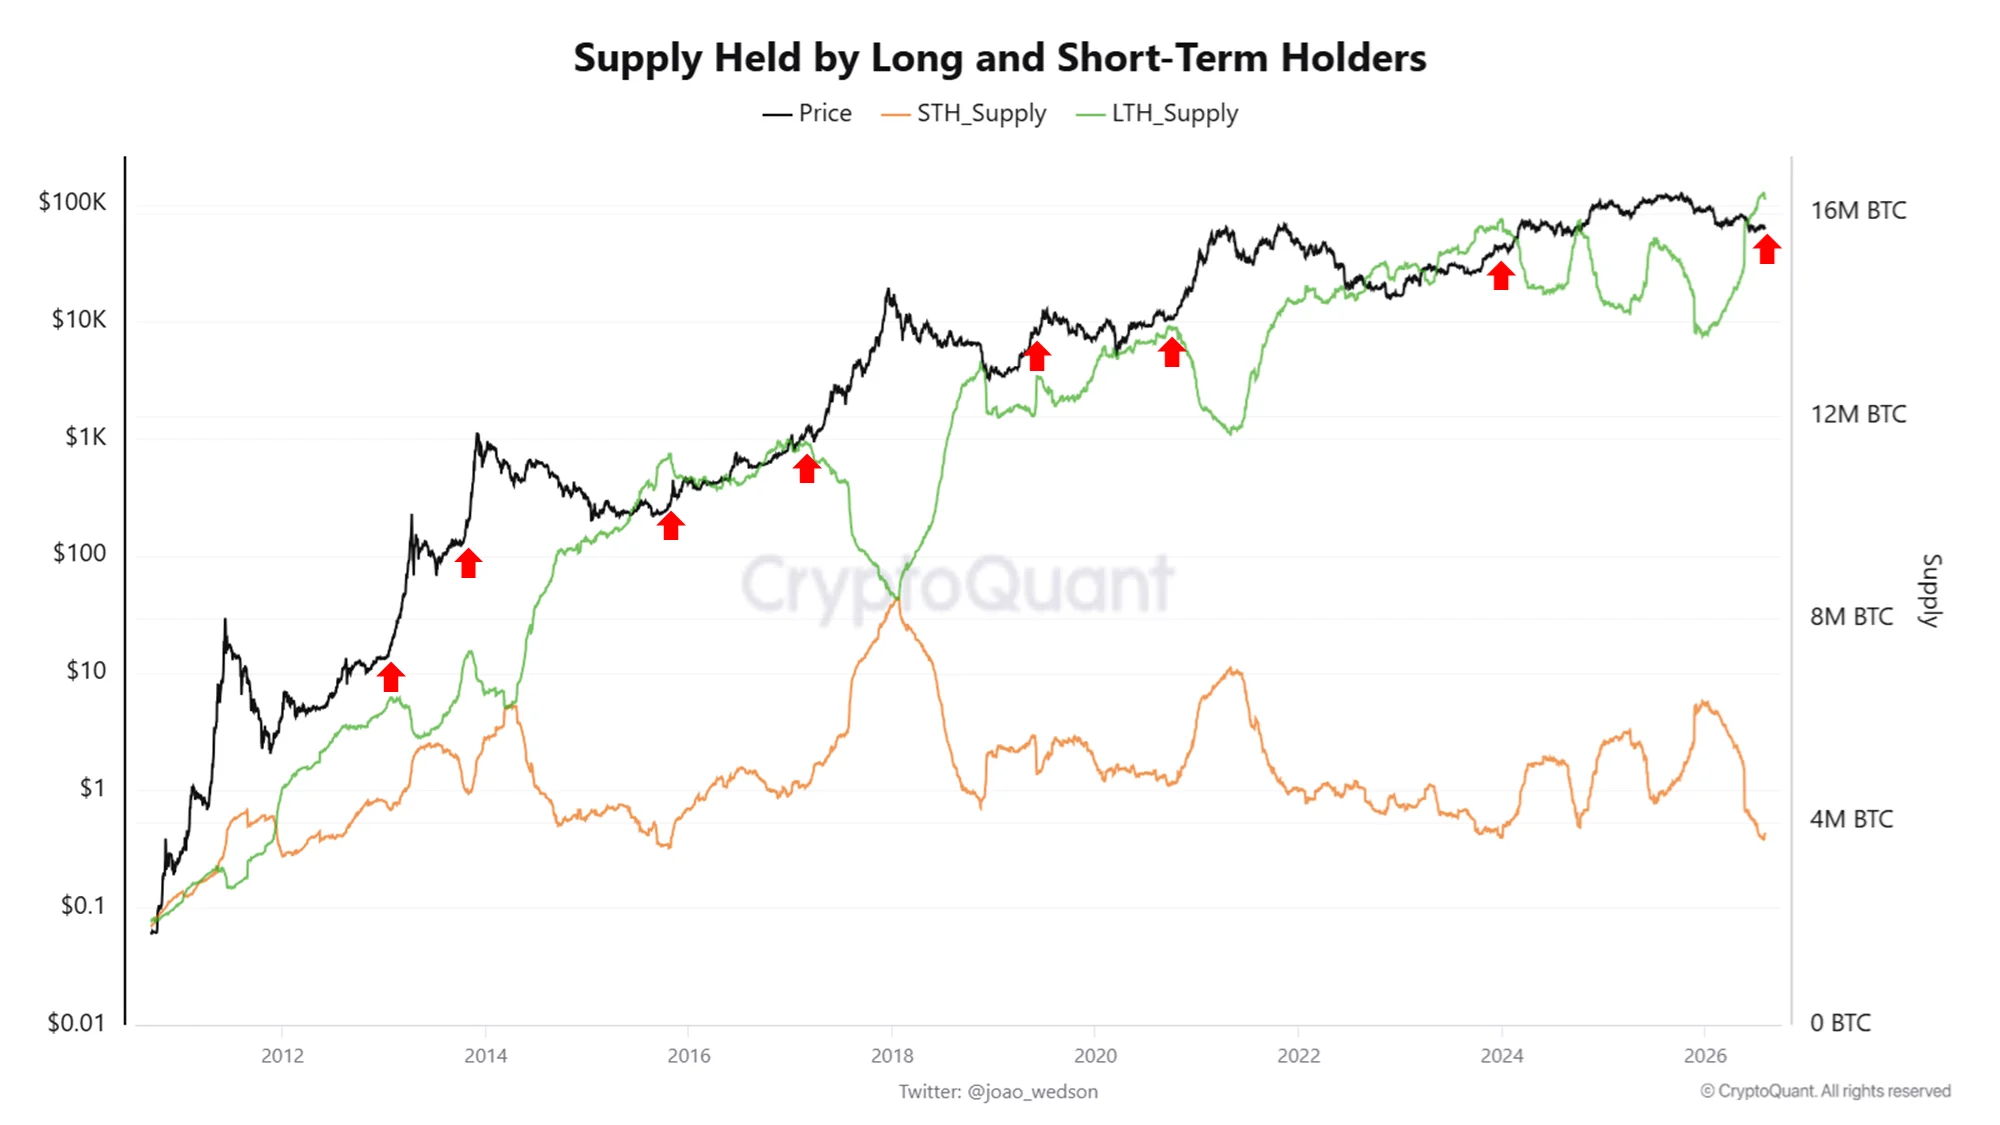
Long-term holder supply tracks coins that have remained inactive long enough to enter that cohort. When those coins are spent, they leave the group and become part of the more active supply.
The decline does not reveal why the coins moved. They may have been sold, transferred between wallets belonging to the same owner, sent to custodians or deposited on exchanges.
Previous Bitcoin rallies have often included periods when older holders gradually distributed coins while new buyers entered the market. Price continued rising when that new demand was strong enough to absorb the additional supply.
The Historical Pattern Is Not a Fixed Cycle Clock
The CryptoQuant analysis compares the latest shift with declines in long-term holder supply that appeared before later rallies in earlier cycles.
The time between the first and second rallies was reportedly eight months in the 2013 cycle, 17 months in 2017 and 16 months in 2021. Approximately 31 months have passed in the current cycle.
That wide difference makes the comparison useful as a description of holder behavior, but unreliable as a timetable.
The market structure has also changed. Spot ETFs and larger institutional participants can absorb, hold and redistribute Bitcoin differently from the mostly retail-led markets of earlier cycles.
The decline in long-term holder supply therefore shows that dormant coins are becoming active again. It does not prove that Bitcoin has entered the same stage seen in a previous cycle.
Demand Must Absorb the Older Coins Being Moved
The next evidence will come from how price behaves while long-term holder supply continues to decline.
A sustained move through the current resistance would indicate that buyers are absorbing the coins returning to circulation without allowing the market structure to weaken. Continued distribution during a failed breakout would carry a less constructive implication because more active supply would be entering a market still unable to clear resistance.
This is why the onchain shift should be read alongside price rather than treated as a standalone rally signal.
Bitcoin has reclaimed its 50-day SMA and reached the top of the descending channel. It still needs to hold above $64,300 before the movement in older coins can be linked to a stronger recovery rather than another redistribution phase inside the current range.
- Disclaimer: This article is for informational purposes only and does not constitute financial or investment advice. Technical levels, moving averages, analyst targets and long-term holder metrics do not guarantee future price performance.
- Methodology: The technical analysis uses the BTC/USD daily Bitstamp chart dated August 4, 2026, including its descending channel, Fibonacci levels, horizontal support and resistance, RSI, and 50-day, 100-day and 200-day SMAs. The broader target uses Michaël van de Poppe’s public August 4 commentary, while the holder analysis uses CryptoQuant’s long- and short-term holder supply data shared by CW8900.



Kosta has reported on cryptocurrency markets and blockchain infrastructure since 2020, bringing over six years of hands-on experience in the crypto industry built through daily tracking of markets, trends, and emerging blockchain developments. Specializing in Bitcoin on-chain analysis, institutional ETF flows, and digital asset price action, his work at Coindoo has been cited by other news agencies and consistently covers market developments with a focus on data-driven reporting across Bitcoin, Ethereum, Solana, and XRP. Over the years, Kosta has contributed to multiple crypto media outlets in different regions, authoring over 6,000 articles across the sector. His reporting spans cryptocurrency markets and the broader fintech industry, tracking not only price action but also the technological and regulatory forces shaping the ecosystem. To support his analysis, Kosta actively leverages on-chain data and metrics from leading platforms such as Santiment, Glassnode, and CryptoQuant, enabling deeper, evidence-based market insights. He believes in the power of transparency and the data that underpins the blockchain ecosystem. His academic background in Marketing Management from Denmark further complements his analytical approach, adding a strong understanding of communication strategy and content positioning to his work.