ADA at a Six-Year Low: Is the Panic Near Exhaustion?

Cardano reached a price it hasn't seen since 24 December 2020, dipping to $0.1385 before steadying at $0.1448. Normally a six-year low means a market everyone has stopped paying attention to.
Key Takeaways
- ADA trades at $0.1448 after a low of $0.1385, its weakest since December 2020.
- Active addresses jumped to 29,025 and social dominance hit 0.33% at the lows.
- The surge in attention is driven by FUD, not optimism.
- A similar pattern preceded mild relief bounces twice earlier in June.
ADA is doing the opposite: as the price dropped, the network lit up and the conversation got louder. That contradiction is the real story here.
The Network Got Busy at the Worst Moment
According to Santiment, ADA’s active addresses spiked to 29,025 just as price hit its floor, while its social dominance, the share of all crypto conversation devoted to it, climbed to 0.33%. That’s the second spike of this kind in June alone. On paper, a quiet, forgotten coin doesn’t behave this way. Activity and chatter surging while price craters is a genuine divergence, and it begs the obvious question: what’s pulling everyone back to Cardano right as it hits a multi-year low?

The answer isn’t a comeback. It’s fear. Charles Hoskinson said he is taking a break, warnings have circulated that more Cardano projects could fail, and the community has split over how the treasury should be governed. Each of those is the kind of headline that drags an asset back into the spotlight for all the wrong reasons. The activity spike, in other words, is a measure of anxiety and argument, people are talking about Cardano because they’re worried, not because they’re buying the dip.
Why Distressed Attention Can Matter
There’s a reason this particular kind of bad-news spike is worth watching rather than ignoring. Santiment’s read is that when maximum negative attention lines up with a surge in on-chain activity, it has tended to mark a point of local exhaustion, and the same pattern preceded mild relief bounces in the two earlier instances visible on its chart this month. The intuition is straightforward: when the loudest, angriest part of the conversation peaks at the same time activity jumps, it can mean the sellers driving the panic are nearly spent.
What that does not mean is that the bottom is in. Two instances is a thread to watch, not a rule to lean on, and the issues fueling the current round of fear, governance disputes and questions about project survival, are substantive rather than noise. A six-year low arrives for reasons, and those reasons haven’t been resolved. The pattern points to possible exhaustion; it doesn’t promise a turn.

How Bad the Chart Looks
The technical picture leaves no doubt about the trend. Every moving average is falling steeply and sits well above price, the 50-day at $0.2096, the 100-day at $0.2304, the 200-day at $0.2800, putting ADA roughly 30% below even its nearest average with nothing close by to catch it. RSI at 26.40 is deep in oversold territory, with the signal line at 31.24 still overhead and no bullish crossover yet, meaning the selling is stretched but momentum hasn’t turned. The one detail that fits the exhaustion idea is volume: at 49.13M it’s elevated, the kind of heavy participation that shows up during capitulation and reaction events rather than slow, quiet bleeding.
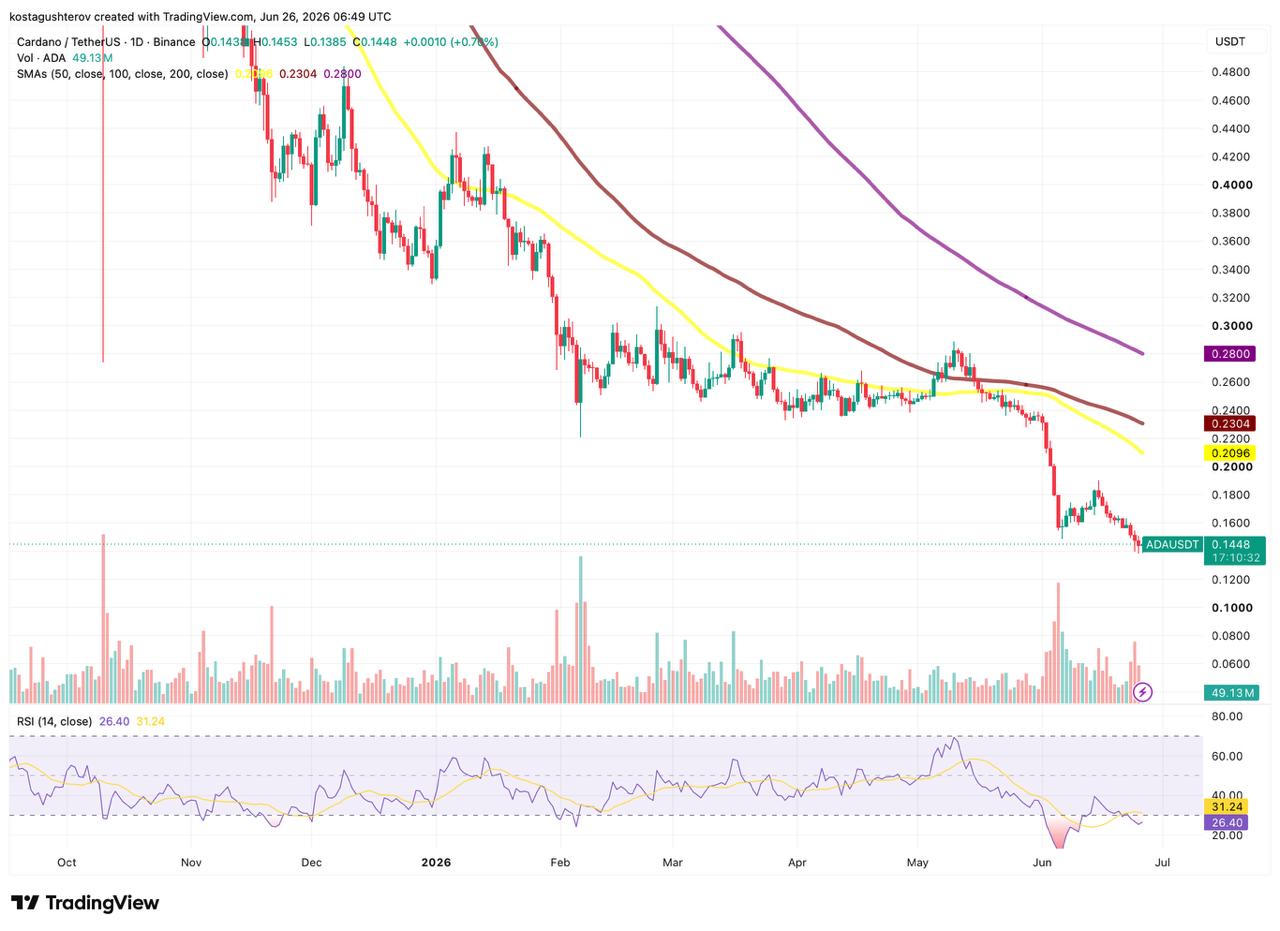
The Levels That Could Decide the Next Move
From here, the map is simple. Yesterday’s $0.138 to $0.140 zone is the line holding ADA up, and below it the chart shows almost no structure until the sub-$0.12 area, so a decisive break could open real downside. On the way up, the first hurdle is the $0.16 to $0.17 band where ADA briefly steadied during the June selloff, with $0.20 beyond it where the falling 50-day waits. The signal that ties the chart to the on-chain story is whether this activity spike resolves into steadier price, the relief pattern Santiment describes, or simply feeds another leg of distressed selling. ADA sits at a real low with a broken chart and a contrarian flicker of life underneath it, and the unresolved governance questions are what hang over which of those two ends up mattering more.

Kosta has reported on cryptocurrency markets and blockchain infrastructure since 2020, bringing over six years of hands-on experience in the crypto industry built through daily tracking of markets, trends, and emerging blockchain developments. Specializing in Bitcoin on-chain analysis, institutional ETF flows, and digital asset price action, his work at Coindoo has been cited by other news agencies and consistently covers market developments with a focus on data-driven reporting across Bitcoin, Ethereum, Solana, and XRP. Over the years, Kosta has contributed to multiple crypto media outlets in different regions, authoring over 6,000 articles across the sector. His reporting spans cryptocurrency markets and the broader fintech industry, tracking not only price action but also the technological and regulatory forces shaping the ecosystem. To support his analysis, Kosta actively leverages on-chain data and metrics from leading platforms such as Santiment, Glassnode, and CryptoQuant, enabling deeper, evidence-based market insights. He believes in the power of transparency and the data that underpins the blockchain ecosystem. His academic background in Marketing Management from Denmark further complements his analytical approach, adding a strong understanding of communication strategy and content positioning to his work.