Bitcoin Recovery Faces $65K Test While Fear Measures Near a Turning Point
Bitcoin has returned to the resistance area that has blocked several recovery attempts since mid-July. The next reaction could show whether the rebound is developing into a broader recovery or merely retesting the top of its recent range.
Key Takeaways
- Bitcoin has returned to the $65,000 area, where several previous recovery attempts were rejected.
- A pullback would bring the $63,200-$63,800 support cluster into focus.
- The 30-day Fear and Greed average has recovered to 26.5, only two points below the 365-day average.
- The narrowing gap is consistent with a possible bottoming phase, although the 2022 cycle shows that sentiment can improve before price reaches its final low.
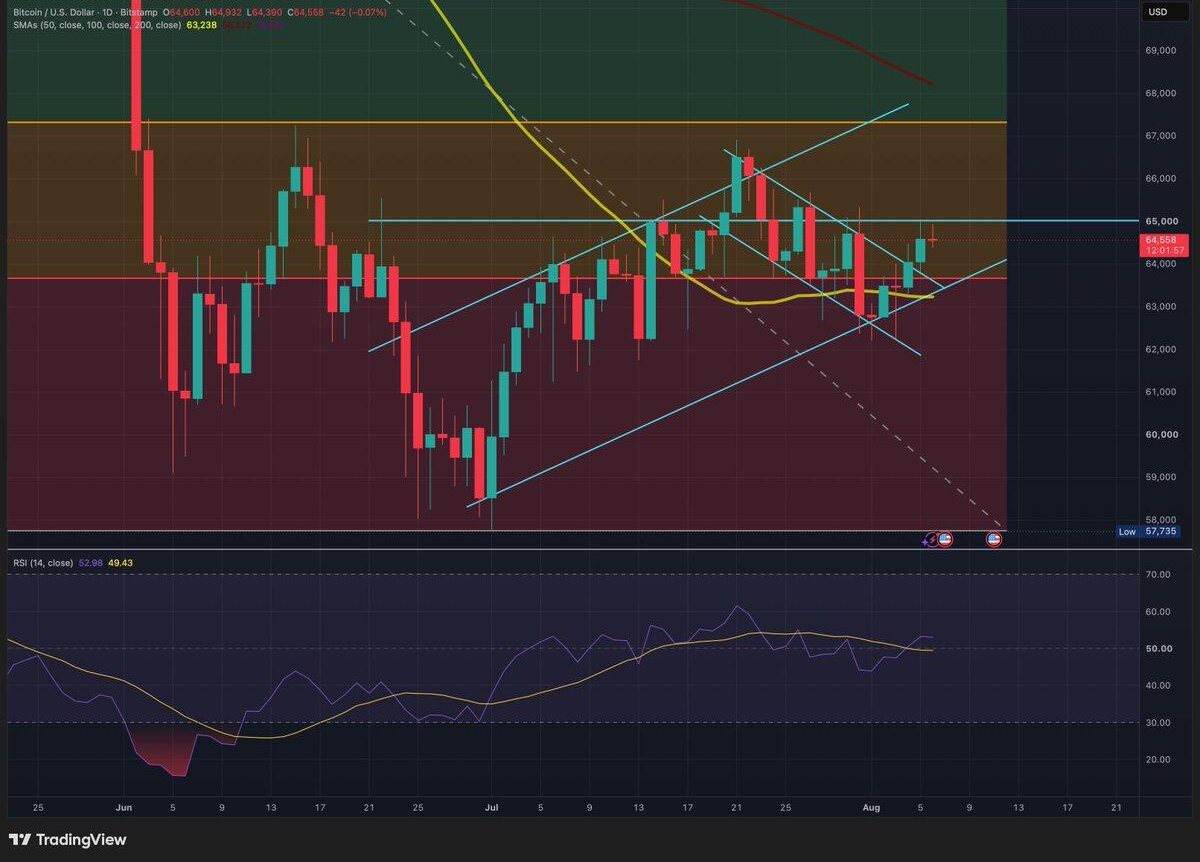
At the time of writing BTC was trading near $64,550 after reaching an intraday high of approximately $64,900. Price was sitting directly beneath horizontal resistance around $65,000, where several recent advances lost momentum.
The Relative Strength Index had recovered to approximately 53 and remained above its moving average near 49.4. Short-term momentum has improved, but price has not confirmed a breakout.
Repeated failures around the current ceiling make another pullback a credible outcome. The more important question is whether buyers return at the support cluster below.
A Pullback Would Test the Recovery Structure
The first important support area extends from roughly $63,200 to $63,800.
The zone combines the 0.236 Fibonacci retracement near $63,800, the former upper boundary of the smaller descending channel, the lower trendline of the wider ascending structure and the 50-day simple moving average near $63,250.
A rebound from this area would preserve the recovery structure and indicate that former channel resistance is beginning to act as support.
A daily close below roughly $63,200 would break the lower edge of the support cluster and weaken the higher-low structure formed since late June.
If buyers clear $65,000 instead, the next visible resistance sits around $67,300. That level becomes relevant only after Bitcoin secures a convincing close above the current ceiling.
Short- and Long-Term Fear Measures Are Converging
Analysis shared through CryptoQuant points to a wider change in market sentiment.
The 30-day and 365-day Fear and Greed averages are now moving closer together.
The 30-day average remained below the lower quartile of its historical distribution from June 9 through July 31 and fell as low as 15.2. It has since recovered to approximately 26.5.
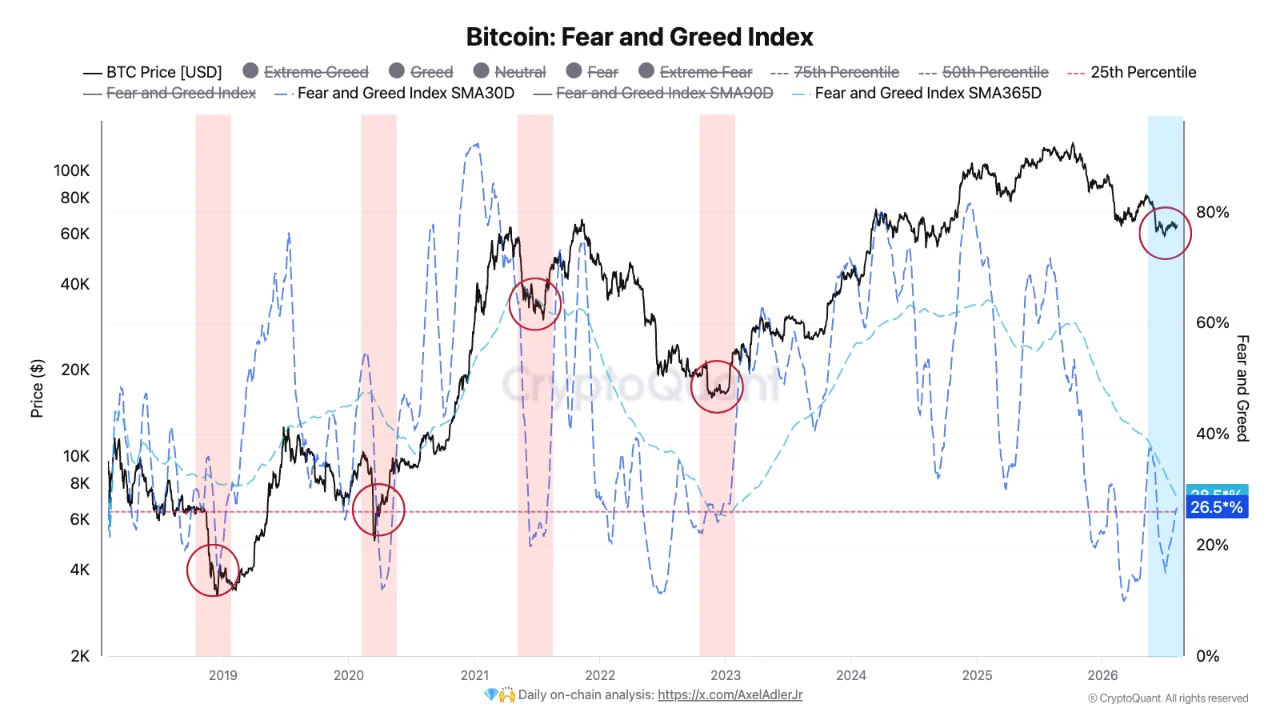
The 365-day average has continued falling and now stands near 28.5, leaving only a two-point difference between the two measures.
The narrowing gap shows that short- and long-term sentiment are converging after an extended period of fear. The CryptoQuant analysis interprets this pattern as consistent with a mature bottoming or accumulation phase.
Bitcoin has recovered from approximately $58,600 and formed higher lows inside the broader ascending channel, although resistance remains intact.
A similar sentiment recovery occurred in August 2022, but Bitcoin subsequently declined by approximately 21% into November before establishing a more durable base.
The comparison shows that sentiment can begin recovering before price reaches its final low. The current convergence is constructive, but it does not prove that the bottom is already in place.
A return below the approximately $58,600 low would weaken the improving price structure. A renewed fall in the 30-day sentiment average would separately show that fear is intensifying again.
Price Still Needs to Confirm the Sentiment Shift
Sentiment would become more constructive if the 30-day Fear and Greed average moves above the 365-day average and both trends begin rising.
Price confirmation could come through either a breakout above the current ceiling or a successful defence of support during a pullback.
For now, sentiment is improving while Bitcoin remains below resistance. The fear data supports a possible bottoming process, but it does not confirm that the market has entered a new upward phase.
- Methodology: The article combines a BTC/USD daily chart captured on August 6, 2026, with Fear and Greed analysis shared through CryptoQuant. Price, RSI, moving-average and channel levels are taken from the TradingView chart. Sentiment averages and the 2022 historical comparison are taken from CryptoQuant analysis.
- Disclaimer: This article is provided for informational and educational purposes only and does not constitute financial or investment advice. Technical structures and sentiment indicators can fail and should not be treated as guarantees of future price performance.



Kosta has reported on cryptocurrency markets and blockchain infrastructure since 2020, bringing over six years of hands-on experience in the crypto industry built through daily tracking of markets, trends, and emerging blockchain developments. Specializing in Bitcoin on-chain analysis, institutional ETF flows, and digital asset price action, his work at Coindoo has been cited by other news agencies and consistently covers market developments with a focus on data-driven reporting across Bitcoin, Ethereum, Solana, and XRP. Over the years, Kosta has contributed to multiple crypto media outlets in different regions, authoring over 6,000 articles across the sector. His reporting spans cryptocurrency markets and the broader fintech industry, tracking not only price action but also the technological and regulatory forces shaping the ecosystem. To support his analysis, Kosta actively leverages on-chain data and metrics from leading platforms such as Santiment, Glassnode, and CryptoQuant, enabling deeper, evidence-based market insights. He believes in the power of transparency and the data that underpins the blockchain ecosystem. His academic background in Marketing Management from Denmark further complements his analytical approach, adding a strong understanding of communication strategy and content positioning to his work.