Zcash: 20% Move on the Table If $569 Holds as Support
Zcash dropped 6.2% in 24 hours before finding support exactly at the 0.236 Fib, now recovering toward the resistance it has failed to break four times in seven days.
Key Takeaways:
- ZEC dropped 6.2% in 24h but found support exactly at 0.236 Fib ($569.98).
- $689 has rejected price four consecutive times in the past seven days.
- From current price, $689 resistance represents approximately a 20% move.
- Futures CVD buy dominant every day since April 26, spot CVD entirely neutral.
- RSI cooling at 53.64, signal at 62.35 – momentum pulling back not reversing.
Zcash dropped 6.2% in the past 24 hours before stopping exactly at the 0.236 Fibonacci retracement level at $569.98. In the past few hours price has been recovering from that level and is now testing it as support rather than sitting on it in distress. The current price of $577.50 is trying to confirm $569 as a floor before making another attempt at the level that has blocked every push higher for the past week.
The $689 problem
The $689 level has now rejected price four times in seven days. Every attempt to close above it has failed. That kind of repeated rejection at the same level isn’t random, it’s where sellers have been consistently showing up, and each failed attempt adds weight to the resistance rather than reducing it. The fifth test, which could come if the current recovery from $569 holds, carries that history with it.
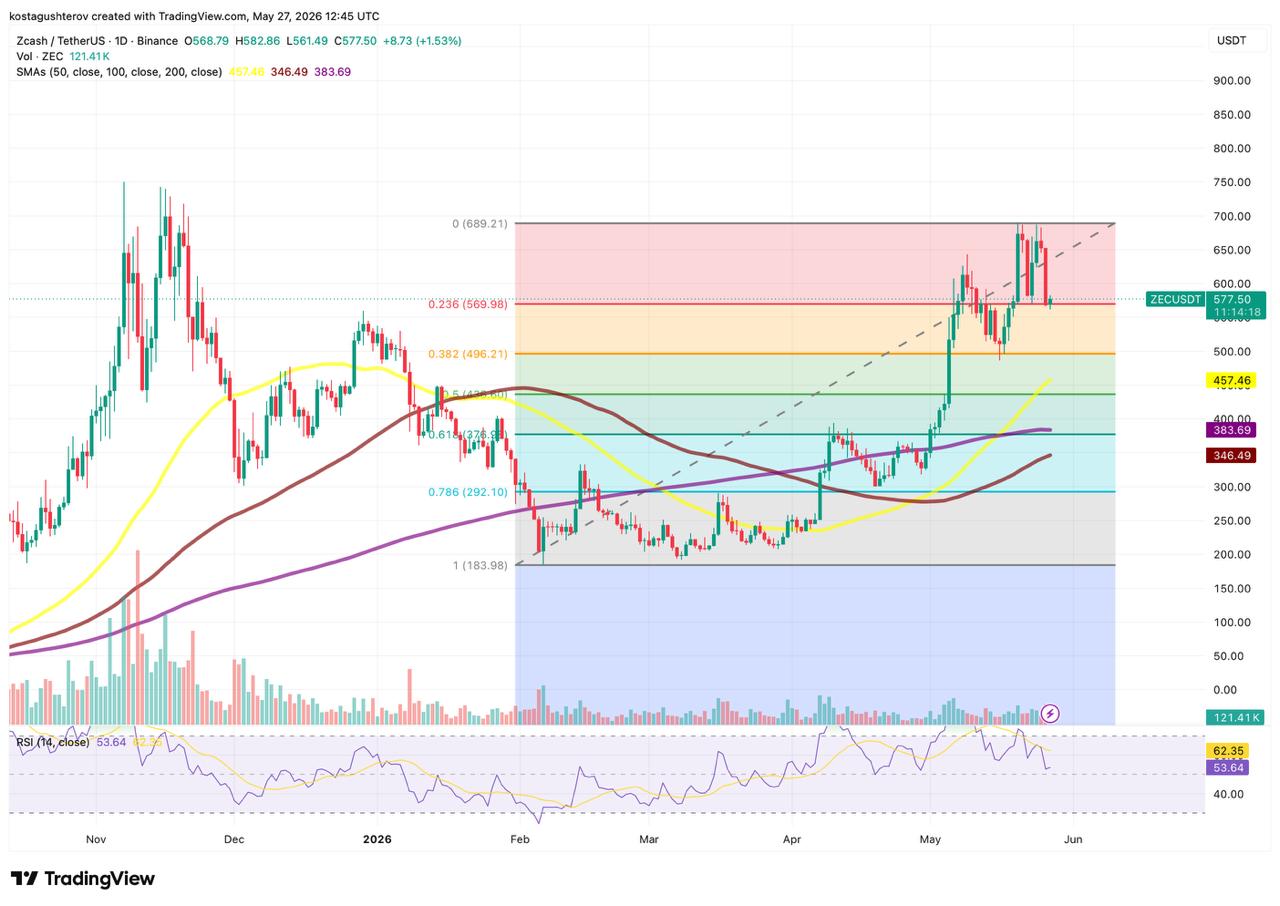
From current price around $577, the $689 resistance represents approximately a 20% move. That’s the theoretical upside on the table if the level breaks and holds, but four previous attempts at that same resistance without a single successful close above it makes clear that nothing about this setup is guaranteed. The move is possible. It hasn’t happened yet despite multiple tries, and each rejection makes the next attempt harder without a meaningful shift in buying pressure or an external catalyst to change the dynamic.
Getting through $689 cleanly and confirming it as support rather than resistance would then open the path toward the previous all-time high around $750, reached in early November 2025, visible on the left side of the daily chart as the peak before the long decline that bottomed near $183 in early 2026. That’s the scenario. Whether it plays out depends on factors the chart alone can’t guarantee.
What makes the current structure different
While Bitcoin and Ethereum are both trading below declining moving averages, Zcash’s daily chart shows the opposite setup. All three SMAs are rising and all three sit below current price, SMA50 at $457.46, SMA100 at $346.49, SMA200 at $383.69. The moving averages are confirming the uptrend from the February lows rather than acting as overhead resistance. That’s a meaningfully different structural position than most of the market right now.
The 0.236 Fib holding yesterday adds to that picture. Price dropped sharply, found the exact technical level, and is now recovering. If $569 gives way on a daily close the next level is the 0.382 Fib at $496.21, which would still keep price above all three rising moving averages, the trend would remain intact, just extended further in the pullback.

RSI cooling from elevated levels
The daily RSI at 53.64 sits below its signal line at 62.35, a gap of nearly 9 points. The signal line is still elevated from the May rally while RSI has pulled back. Momentum cooled from what was an overbought reading during the push toward $689, consistent with the price action. RSI at 53.64 is neutral territory, not flipping bearish, but it’s not building the kind of momentum that would support a strong fifth attempt at $689 right now. A few days of consolidation around $569-$580 that lets RSI reset would improve the odds for the next attempt more than an immediate push would.
The futures vs spot divergence
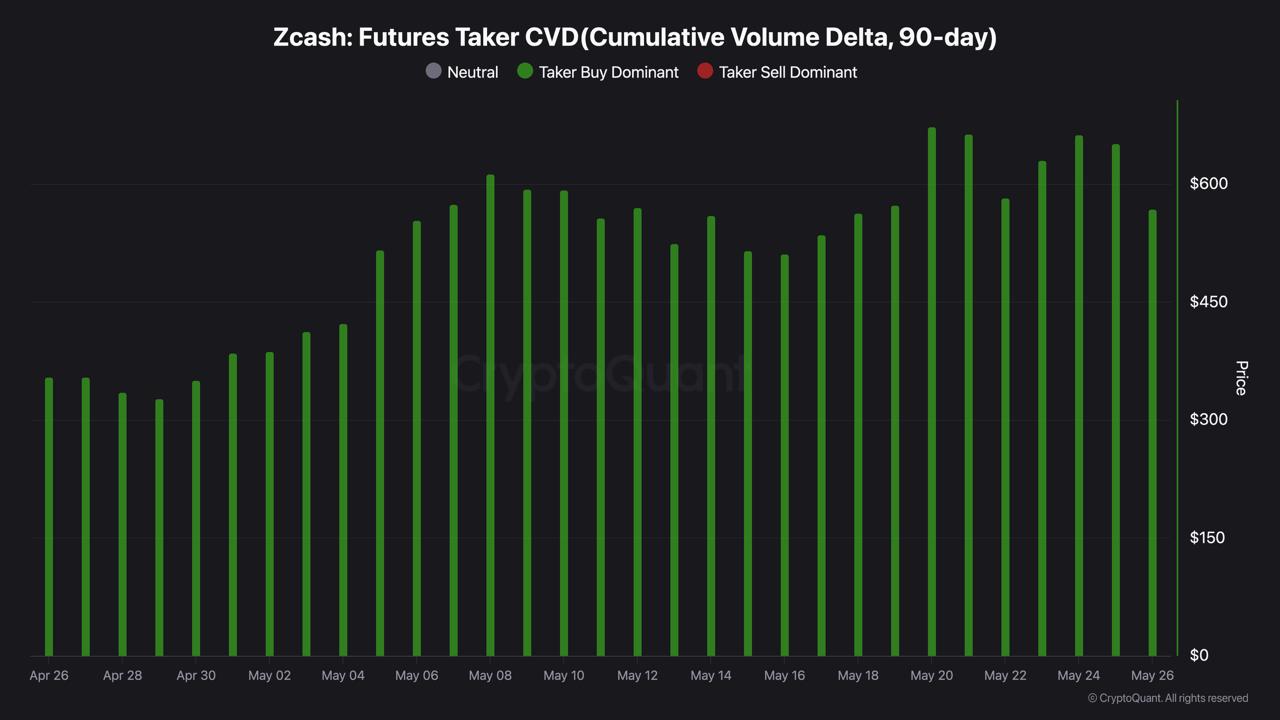
The CryptoQuant CVD data adds an important layer. The Futures Taker CVD chart shows buy dominant every single day from April 26 through May 26 — 30 consecutive days without a single neutral or sell dominant session, with bar sizes growing through the May 20-24 period when price pushed hardest toward $689.
The Spot Taker CVD for the same period tells a completely different story. Neutral bars throughout, not one green or red session. The entire ZEC move from the lows has been driven by futures buyers with no spot accumulation participating.
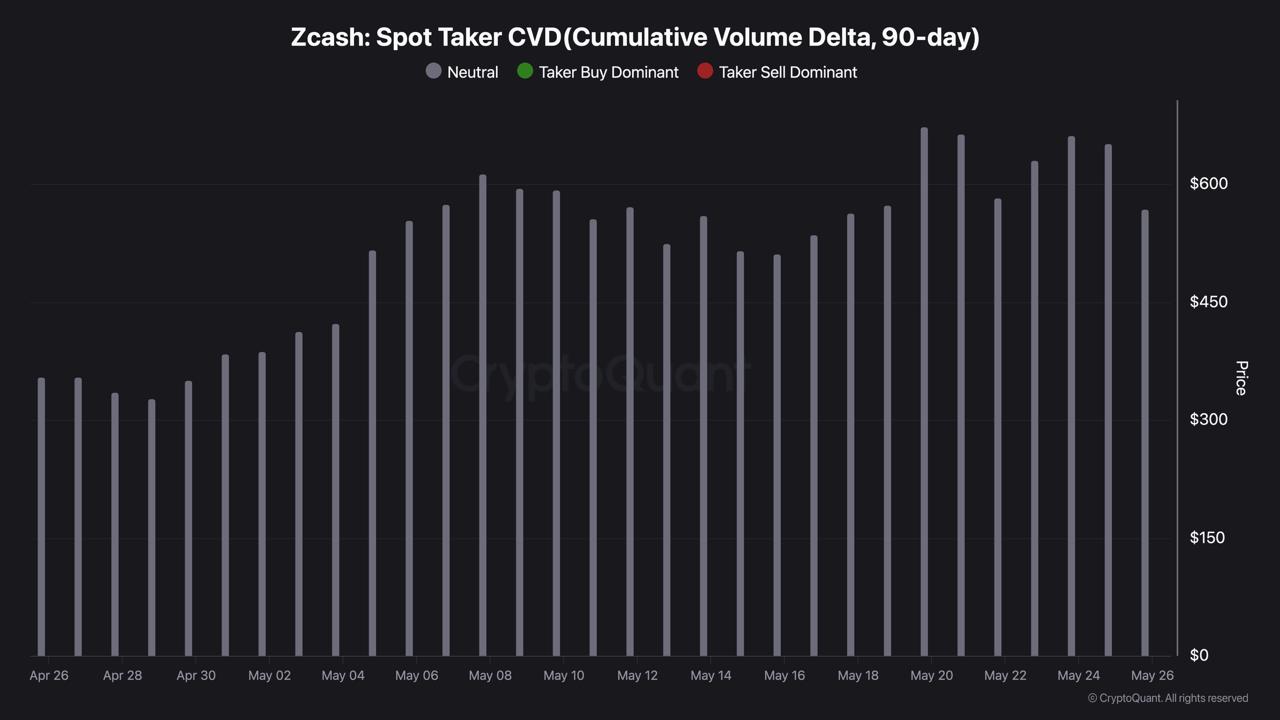
That distinction matters for reading how reliable the setup actually is. Futures-driven moves can reverse faster than spot-driven ones because leveraged positions unwind quickly when stops are hit. The 6.2% drop in 24 hours is consistent with futures longs getting squeezed on the $689 rejection. The absence of spot buyers means there’s no deep accumulation base underneath the futures activity — which is part of why the resistance keeps holding.
Three waves of leverage, three rejections
The Coinglass open interest data for May tells the story of this resistance more precisely than price alone does. OI entered May around $500-600M and then exploded – climbing to approximately $1.5B by May 9-10 as price pushed toward $600 for the first time. That wave got partially flushed and OI dropped back. Then it rebuilt again to approximately $1.65B around May 21-22 when price hit $689 for the first attempt. Rejected again, OI flushed partially. Then rebuilt again to the current $1.65B as price recovered from yesterday’s drop.
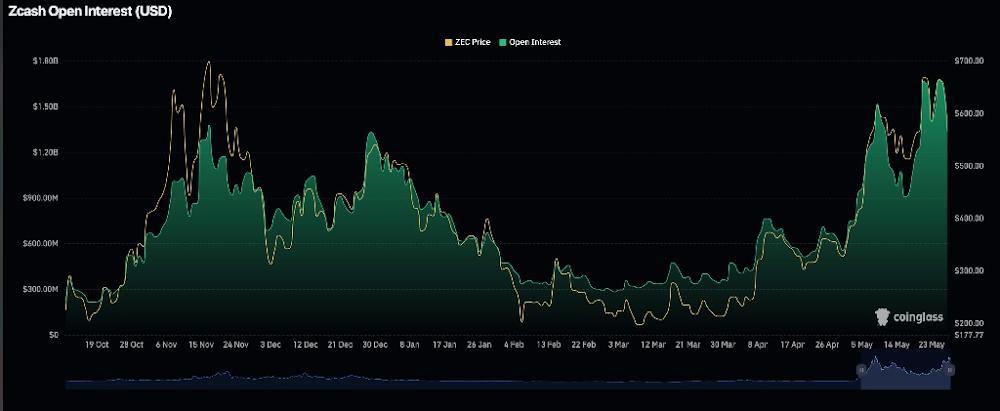
Three separate waves of leveraged capital each building to $1.5B or above. Three rejections at $689. None of the flushes were complete — OI rebuilt to similar levels after each squeeze, meaning new leveraged buyers kept entering after each failed attempt. The market has been cycling the same trade three times without breaking through.
The current OI of approximately $1.65B is the fourth wave of leverage accumulating below the same resistance level. That creates two very different outcomes depending on which way $689 resolves.
If the level finally breaks with this much OI behind it, the short squeeze on top of the leveraged long positioning could accelerate the move toward $750 faster than price alone would suggest. Shorts caught on the wrong side of a $689 break with $1.65B in open interest would add meaningful fuel to the move.
If $569 breaks instead, three waves of partially flushed longs plus the current fourth wave could unwind simultaneously. The path toward $496 would be faster and sharper than a spot-only market would produce.
If $569 holds and futures buyers return for a fifth attempt at $689, the spot CVD is the thing worth watching alongside the OI. A move that finally breaks $689 with spot buyers joining in alongside the futures positioning would be a different quality of breakout than the previous four attempts. A fifth attempt on futures alone, against resistance that has already rejected three full waves of $1.5B+ OI, faces the same problem the previous attempts did, just with more history behind it.
Where things stand
The 20% move toward $689 is theoretically on the table if $569 holds and buying pressure builds. The structural setup is there, rising SMAs below price, Fib support holding, RSI with room to recover. But three waves of $1.5B+ OI failing at the same resistance without a single close above it is a clear signal that leverage alone hasn’t been enough. Realistically, a shift in spot market participation or an external catalyst would improve the odds meaningfully.
The setup exists. The confirmation doesn’t yet. And in a market where $689 has stopped many separate waves of leveraged buying already, assuming the fourth wave works differently without something changing would be getting ahead of what the data actually shows.
UPDATE 28.05.2026
Yesterday we flagged the multiple top pattern as a bearish theory to watch – specifically that if price confirmed a daily close below the 0.236 Fib neckline at $569.98, the pattern could become active. That confirmation arrived. Yesterday’s daily candle closed below $569 and today price is continuing lower, currently trading at $524, down 3.37% on the day. The broader market isn’t helping – Bitcoin trading around $73,000 is adding selling pressure across the board, and ZEC is moving with it.
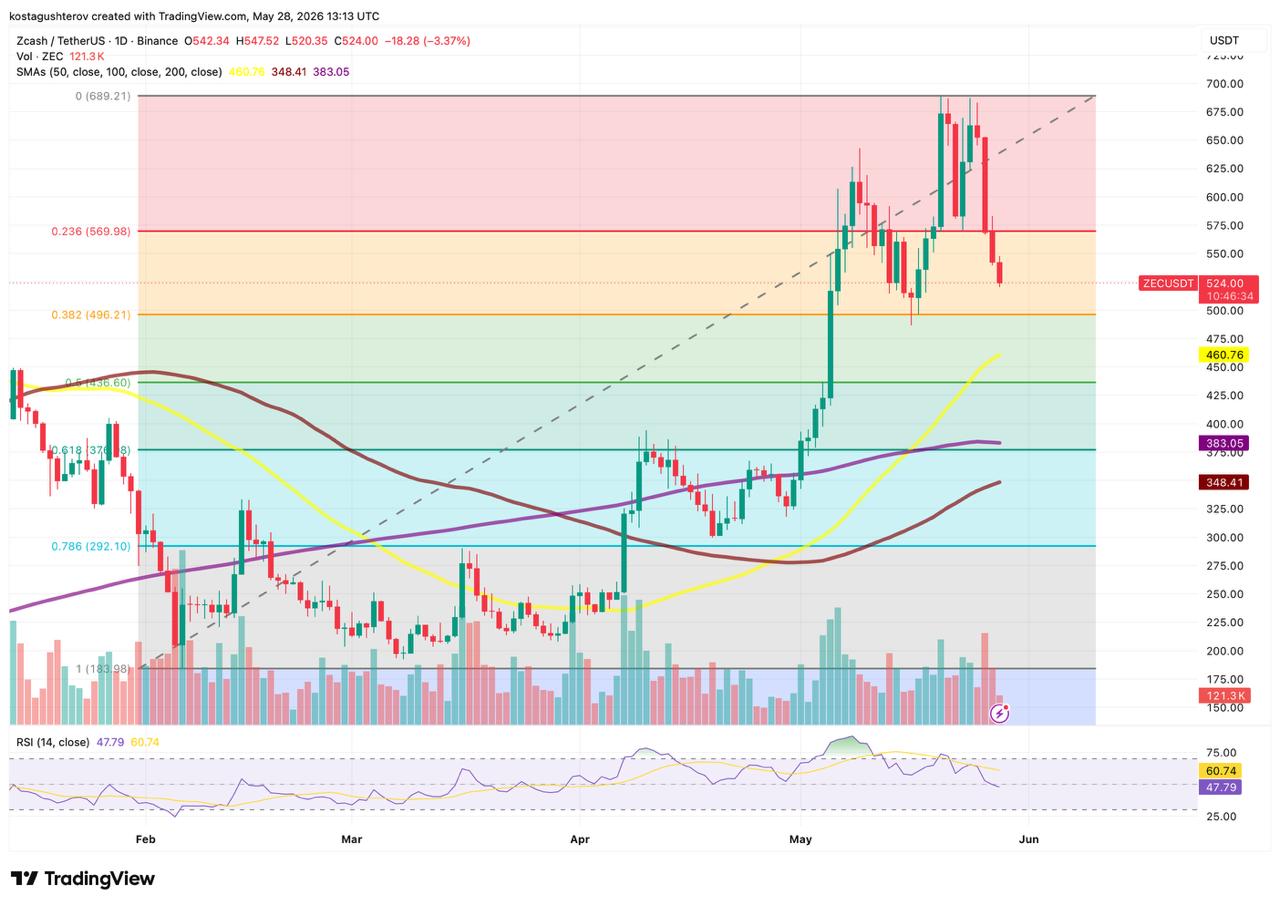
The bearish theory is now on for now. The multiple top pattern – four failed attempts at $689 followed by a confirmed break below the neckline – is pointing toward the 0.382 Fib at $496.21 as the next target. What makes the path there potentially faster and sharper than a normal correction is the open interest picture we outlined yesterday. The 0.382 Fib at $496 could be the level to watch now. Whether it holds or fails might determine if this correction stabilizes or extends further.
The information provided in this article is for educational purposes only and does not constitute financial, investment, or trading advice. Coindoo.com does not endorse or recommend any specific investment strategy or cryptocurrency. Always conduct your own research and consult with a licensed financial advisor before making any investment decisions.



Alexander Zdravkov is a market analyst and crypto journalist with interests in economics, broader financial markets and digital assets. His journey into crypto began more than four years ago, driven by a fascination with the rapid evolution of blockchain technology and the transformative potential of decentralized finance. He began analyzing market cycles and identifying emerging trends before they reach the mainstream. He holds a degree in International Relations - a background that helped shape his broader perspective on global economics, geopolitics, and the interconnected nature of modern financial markets. Whether covering the latest developments in the crypto sector or exploring broader macroeconomic themes, Alexander focuses on giving readers context rather than simply repeating headlines. During his career, he has authored more than 5,000 articles covering cryptocurrencies, traditional finance, and global market developments. His work spans everything from Bitcoin and altcoins to macroeconomic trends influencing risk assets worldwide.