Crypto Crowd Turns Bearish for 10 Days: What the Pattern Signals
Ten days of rising bearish sentiment across crypto social media - Santiment data shows this pattern has historically preceded recoveries, not continued declines.
Key Takeaways:
- Bearish social media calls rising 10 consecutive days across crypto.
- Santiment marks four previous bearish crowd moments, all preceded recoveries.
- Previous bullish crowd peaks accurately called every local top on chart.
- Crowd consistently late – bearish at bottoms, bullish near tops.
- Pattern is a probability signal, not a timing tool or guarantee.
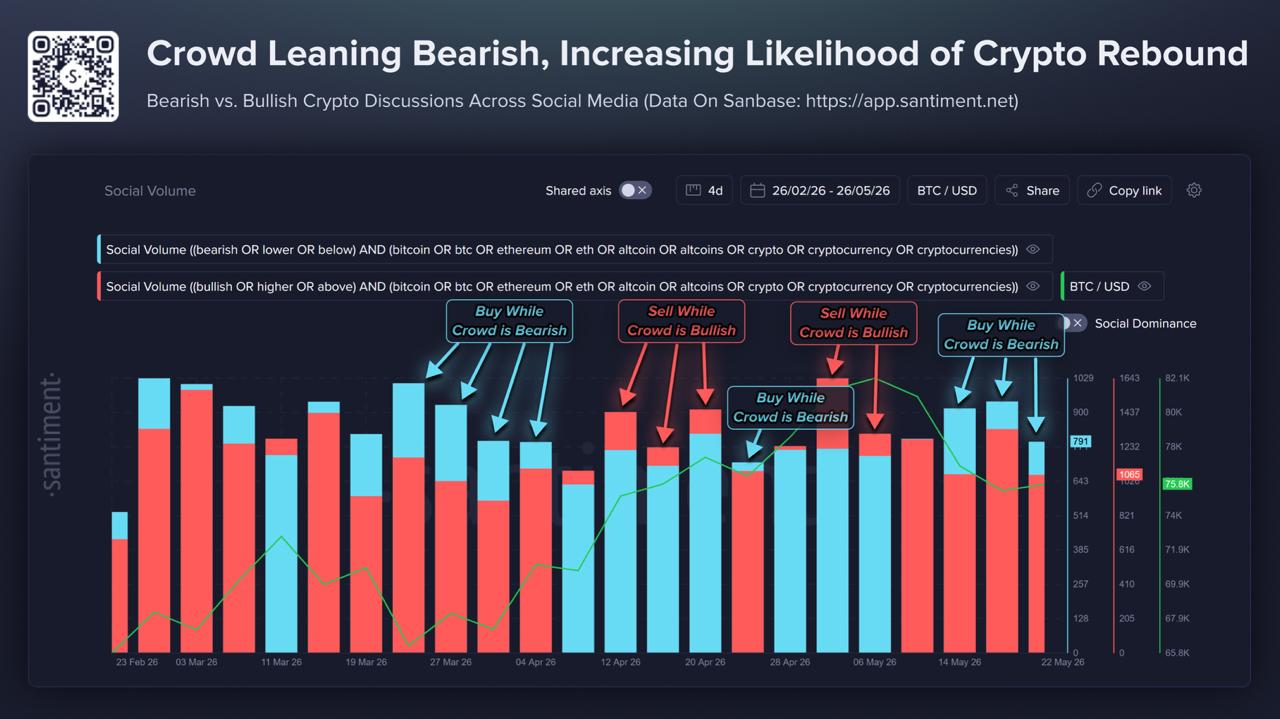
The Santiment data covering crypto social media discussions from February 26 to May 26, 2026 shows bearish conversations have been rising for 10 straight days and now dominate the overall volume. Blue bars representing bearish expectations are running taller than the red bullish bars across the most recent data points. More people across social media are currently expecting lower crypto prices than higher ones.
That fact alone doesn’t mean much. What gives it context is the historical pattern behind it.
What the chart shows across four months
The Santiment dataset tracks bullish versus bearish crypto discussion volume across social media over the full February to May 2026 period. Annotated directly on the chart are the moments where crowd sentiment leaned heavily in one direction.
Santiment annotates four separate “Buy While Crowd is Bearish” signals directly on the chart across the period. Each marks a point where bearish social discussion dominated the conversation, the same condition present right now. Looking at what price did following each of those four moments, the chart shows recovery rather than continued decline in each instance.
The pattern runs equally in the other direction. Santiment marks three “Sell While Crowd is Bullish” moments on the same chart, each at points where bullish discussion peaked. Price pulled back following each of those signals as well.
The underlying dynamic is straightforward. When bearish sentiment dominates social media, a large portion of holders who intended to sell have already acted. The remaining market participants are either long-term holders or traders already positioned short. With less fresh selling pressure available, price becomes more sensitive to any new demand that appears. The opposite condition, peak bullish sentiment, tends to mark points where most buyers have already entered, leaving fewer participants available to push price higher.
Where the current reading sits
The current 10-day bearish streak lands at a moment when Bitcoin is trading around $75,500 following a decline from the May peak near $82,800. The social sentiment chart and the price chart are aligned, fear has been building as price has fallen, which is the typical pattern. What the Santiment data highlights is that this alignment has historically marked sentiment exhaustion rather than the beginning of a further leg down.
Santiment’s own framing is measured: this is historically a sign that prices can rebound with little resistance, because the crowd isn’t expecting it. The emphasis is on historical pattern, not certainty.

What this signal doesn’t do
Crowd sentiment data is a contrarian indicator with a historical track record on this chart. It is not a timer and it doesn’t override macro conditions.
Seven consecutive days of Bitcoin ETF outflows, ongoing geopolitical pressure from the Iran-US conflict, and a price chart trading below all three major moving averages are all present simultaneously. None of those factors disappear because social media sentiment has turned bearish. Institutional selling, which has been the primary driver of recent outflows according to CoinShares data, doesn’t respond to retail sentiment readings.
What the sentiment data contributes is a probability context. In the four previous instances on this chart where the crowd leaned this heavily bearish, price subsequently recovered. That’s four data points from a four-month window, a limited sample that reflects a specific market period rather than a long-term statistical study.
The pattern is worth tracking. It has been consistent across this chart period and the logic behind it is sound. But reading it as a signal that a recovery is imminent or certain goes further than the data supports. Reading it as a sign that the crowd is currently positioned on the side that has historically been wrong at turning points is the more defensible interpretation.
The 10-day bearish streak is on the chart. What price does next will either add another data point to the pattern or break it.
The information provided in this article is for educational purposes only and does not constitute financial, investment, or trading advice. Coindoo.com does not endorse or recommend any specific investment strategy or cryptocurrency. Always conduct your own research and consult with a licensed financial advisor before making any investment decisions.



Alexander Zdravkov is a market analyst and crypto journalist with interests in economics, broader financial markets and digital assets. His journey into crypto began more than four years ago, driven by a fascination with the rapid evolution of blockchain technology and the transformative potential of decentralized finance. He began analyzing market cycles and identifying emerging trends before they reach the mainstream. He holds a degree in International Relations - a background that helped shape his broader perspective on global economics, geopolitics, and the interconnected nature of modern financial markets. Whether covering the latest developments in the crypto sector or exploring broader macroeconomic themes, Alexander focuses on giving readers context rather than simply repeating headlines. During his career, he has authored more than 5,000 articles covering cryptocurrencies, traditional finance, and global market developments. His work spans everything from Bitcoin and altcoins to macroeconomic trends influencing risk assets worldwide.