XRP Returns to Its Critical $1.35 Support With $488M in Open Interest Watching

XRP trades at $1.36 on the daily chart as of May 21, holding above a horizontal support zone that has been tested multiple times since mid-April while the derivatives market builds its heaviest positioning in two months directly around that level.
Key Takeaways
- XRP closed at $1.3633, approximately $0.013 above the $1.35 support zone.
- $1.35 held as support three times since mid-April on daily chart.
- Open interest at $488.3M on Binance.
- SMA50 at $1.3954 and SMA100 at $1.3982 converging above price as dual resistance.
- RSI at 42, signal at 51.71: momentum negative, structure holding.
Why the $1.35 Zone Has Structural Weight
The $1.35 level has held three tests since mid-April, and each hold has added structural weight to the zone: the more times a support level absorbs selling without breaking, analytically the larger the cluster of stop-loss orders that tends to accumulate below it, and the more violent the move becomes if it finally gives way. The daily chart shows a visible horizontal line at that level with price touching or approaching it on multiple occasions across the April-May period, recovering each time.
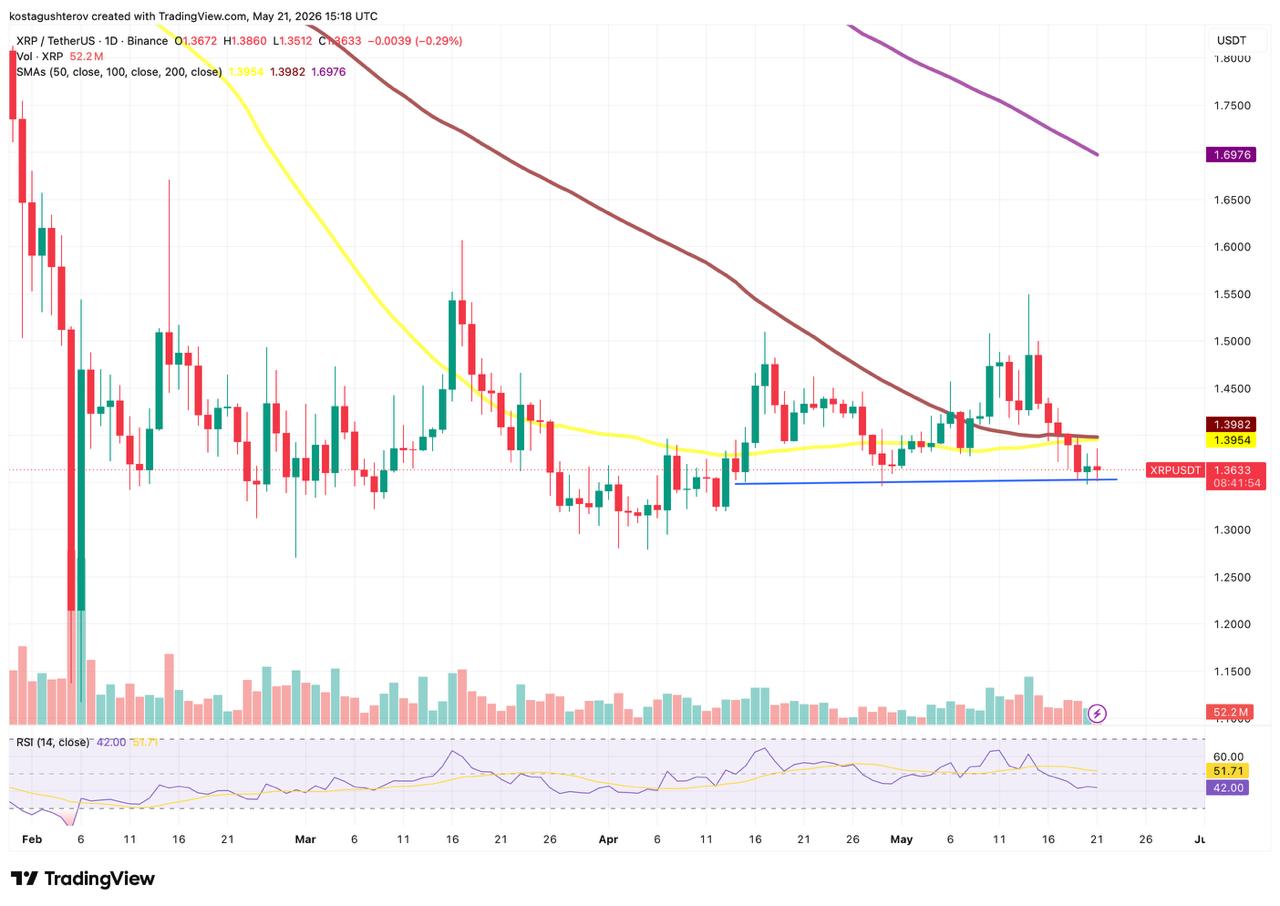
At $1.3633, price sits $0.013 above the zone. That gap represents less than 1% of current price, meaning a sub-1% daily decline brings the fourth test without requiring any structural deterioration beyond what the session already shows.
What High Open Interest Adds to the Support Picture
Open interest at $488.3M near a two-month high while price sits less than 1% above the $1.35 support means the derivatives market is heavily positioned at the exact moment the support zone faces its most crowded test.
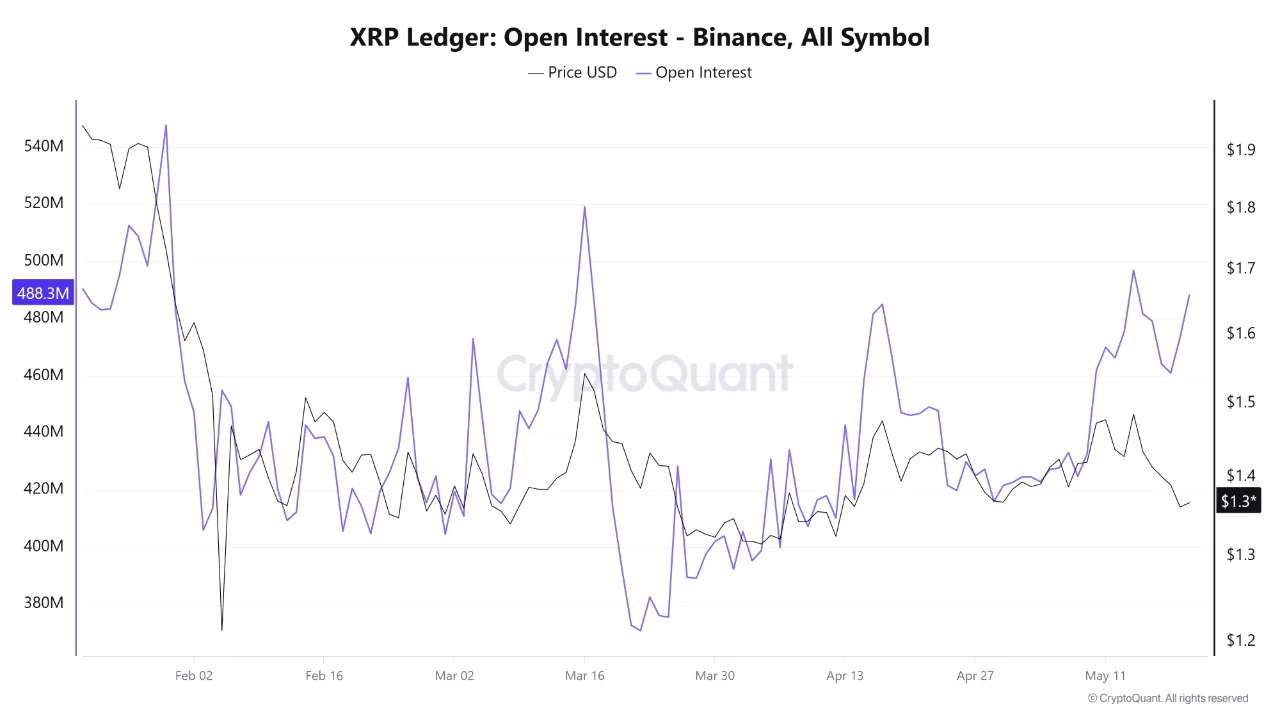
According to CryptoQuant analysis, OI approached $500M in mid-May, its highest level since March, before pulling back slightly to the current reading. The source notes that elevated open interest is not inherently bullish or bearish but is often associated with increased potential volatility when a strong price move occurs in either direction. At $1.35, that observation becomes specific: a breakdown through well-tested support with this level of open interest would trigger leveraged long liquidations that accelerate the move. A hold and recovery from that zone with OI this elevated would compress into short liquidations instead.
The MA Structure and RSI Condition
The SMA50 and SMA100 separated by less than half a cent above current price are not two resistance levels: they are one combined ceiling that price must clear in a single move, and the RSI at 42 with its signal line nearly 10 points above it confirms the momentum to attempt that move has not yet arrived.
The SMA50 sits at $1.3954 and the SMA100 at $1.3982, both declining and positioned $0.032 and $0.035 above current price respectively. The SMA200 at $1.6976 is declining steeply and sits $0.334 above current price, a level that defines the ceiling of any recovery scenario but is not relevant to the immediate structure.

What the Setup Resolves To
XRP is sitting in a compressed zone. Support has held three times at $1.35 below, a converging MA ceiling sits $0.032 above, and heavily leveraged derivatives positioning on both sides of the current price means the next directional move will be amplified regardless of which way it goes. The RSI at 42.00 has remained in sub-50 territory throughout the support tests, confirming that momentum has been negative during every hold, which means the support is absorbing selling from a market with deteriorating momentum rather than one that is neutral or recovering.
The next three days might settle the question the chart has been asking since mid-April. A daily close above $1.40, clearing both the SMA50 and SMA100 simultaneously while OI holds or expands, confirms the compressed setup has broken upward and the three-test support zone has done its job. A break below $1.35 on above-average volume tells a different story entirely: the hold was not accumulation but delay, and the liquidation cascade the elevated OI enables will define how far the move extends.
The information provided in this article is for educational purposes only and does not constitute financial, investment, or trading advice. Coindoo.com does not endorse or recommend any specific investment strategy or cryptocurrency. Always conduct your own research and consult with a licensed financial advisor before making any investment decisions.

Alexander Zdravkov is a market analyst and crypto journalist with interests in economics, broader financial markets and digital assets. His journey into crypto began more than four years ago, driven by a fascination with the rapid evolution of blockchain technology and the transformative potential of decentralized finance. He began analyzing market cycles and identifying emerging trends before they reach the mainstream. He holds a degree in International Relations - a background that helped shape his broader perspective on global economics, geopolitics, and the interconnected nature of modern financial markets. Whether covering the latest developments in the crypto sector or exploring broader macroeconomic themes, Alexander focuses on giving readers context rather than simply repeating headlines. During his career, he has authored more than 5,000 articles covering cryptocurrencies, traditional finance, and global market developments. His work spans everything from Bitcoin and altcoins to macroeconomic trends influencing risk assets worldwide.