Ethereum Shows a Bearish Pattern While Some Traders Might Accumulate

Ethereum broke a triangle, flushed leveraged longs, and failed to recover. One analyst calls it a breakdown. Another calls it the entry.
Key Takeaways
- Triangle breakdown confirmed, $1,350 support level in play if structure not reclaimed.
- Van de Poppe: daily RSI below 30 and ETH/BTC at 0.02748 signal accumulation zone.
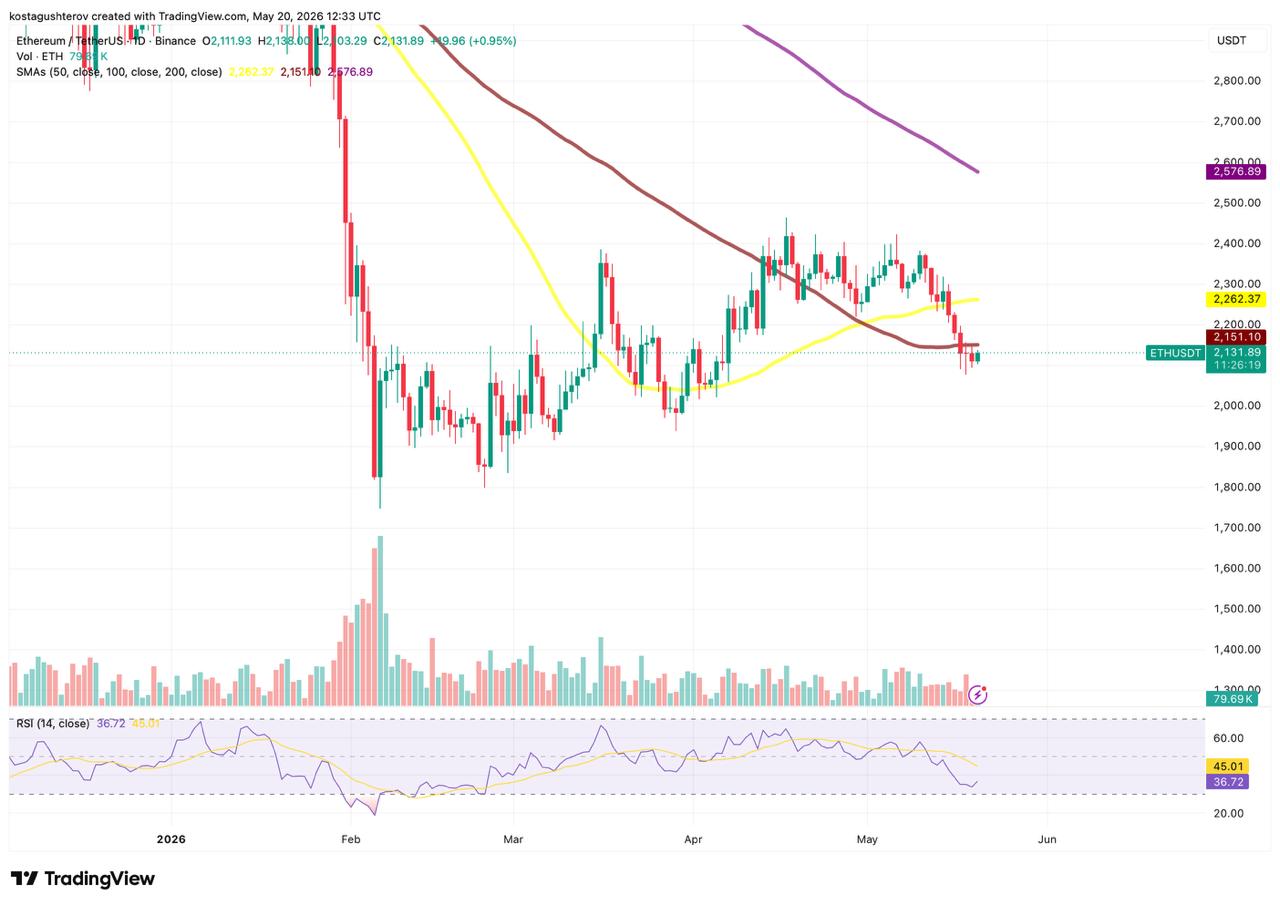
- SMA100 at $2,151.10, only $19 above current price, declining toward convergence.
What Each Analyst Is Actually Reading
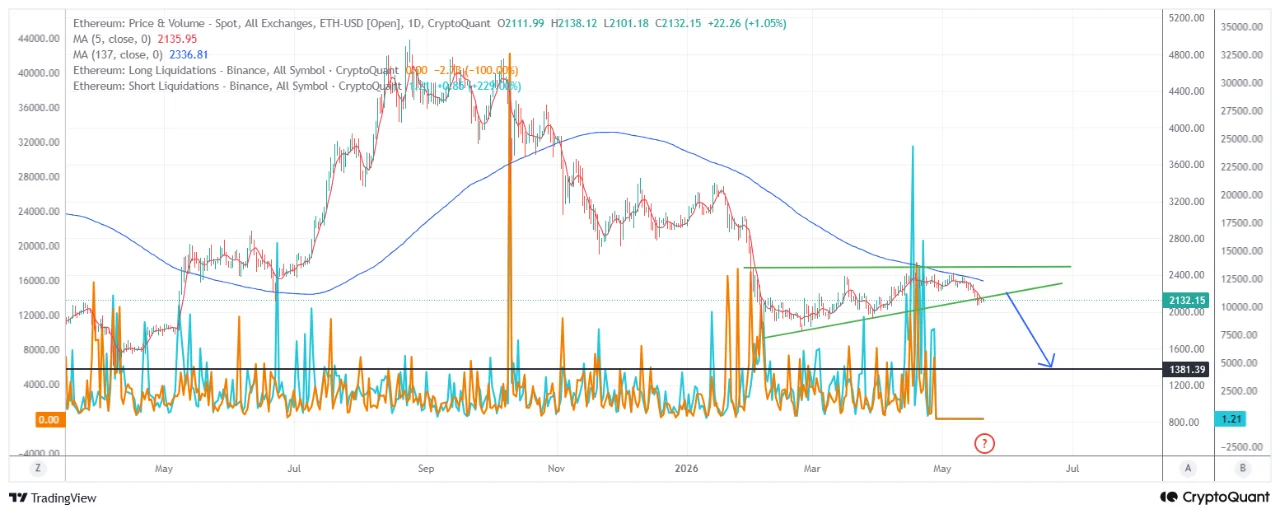
CryptoQuant’s analyt identifies a downside breakout from a triangle formation on the CryptoQuant daily chart, noting that the short-term 5-period MA at $2,135.95 has fallen below the long-term 137-period MA at $2,336.81 and both are sloping downward. After recent Binance liquidation spikes, price failed to hold gains and returned to session lows each time, which is the behavior PelinayPA reads as the breakdown pattern holding. If Ethereum fails to reclaim the broken triangle, the analyst suggests selling pressure could accelerate toward the $1,350 support level.
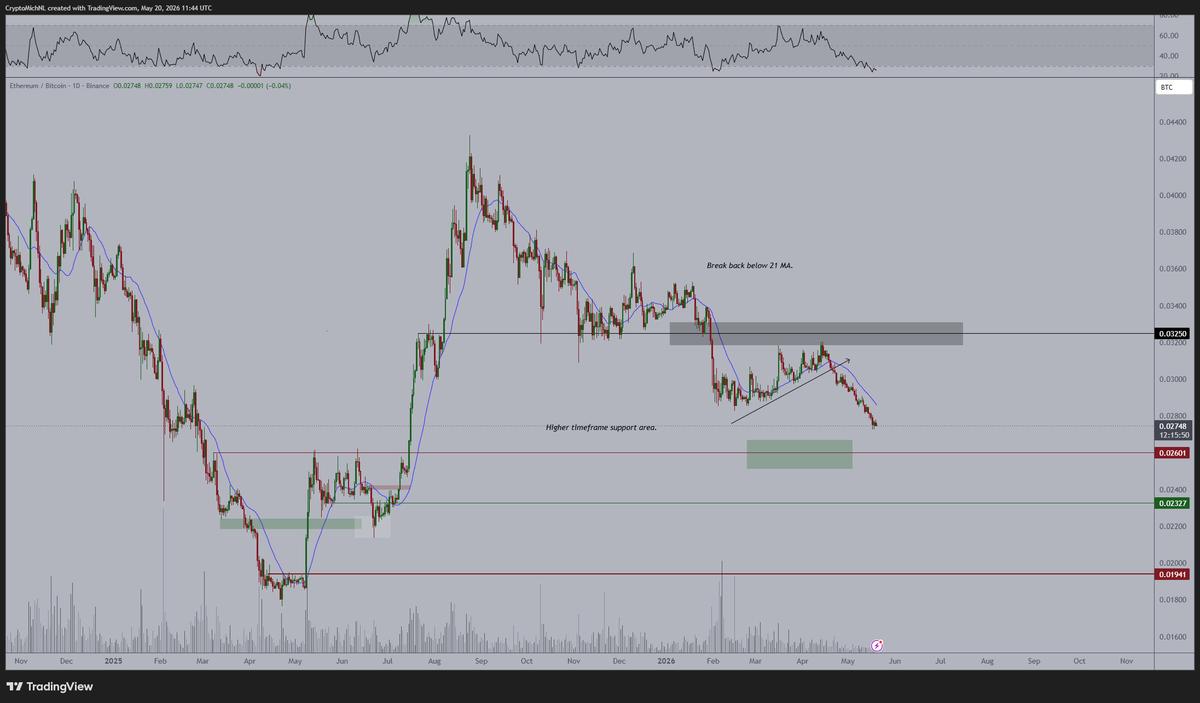
Michaël van de Poppe argues the same price action represents an accumulation zone, citing a daily RSI he describes as below 30 and an ETH/BTC ratio approaching the 0.0260 support level after failing to break above 0.03250. He acknowledges more downside is possible and notes the process could take weeks.
PelinayPA’s triangle breakdown and van de Poppe’s accumulation zone are not contradictory readings of the same chart: they are readings of different things, one measuring where price is going in the current structure, the other measuring where the risk-reward becomes favorable against a multi-year ratio setup. Both can be correct simultaneously: price can continue lower within the broken triangle while the ETH/BTC ratio simultaneously enters a zone where long-term accumulation makes statistical sense.

Why the RSI Readings Are Not Comparing the Same Thing
Van de Poppe states the daily RSI is below 30, but that reading comes from the ETH/BTC ratio chart, not the ETH/USDT price chart. The TradingView daily ETH/USDT chart captured at 12:33 UTC shows RSI at 36.72 with the signal line at 45.01.
These are two different instruments: one measures ETH’s price in Bitcoin terms, the other in dollar terms. An oversold RSI on the ETH/BTC ratio means ETH has been sold aggressively relative to Bitcoin, not necessarily relative to the dollar. The signal line at 45.01 sits 8.29 points above the ETH/USDT RSI and has not begun moving toward it, which means dollar-denominated momentum deterioration is still being registered rather than being priced in. Van de Poppe’s below-30 RSI is a ratio signal, not a price signal, and the two should be read as complementary rather than equivalent.
Why the SMA100 Convergence Is the Immediate Technical Question
The SMA100 at $2,151.10 is only $19 above current price and declining, which means ETH is not approaching resistance from below but waiting for resistance to descend to it, and whether that convergence produces a rejection or a reclaim will define the next directional move on the daily chart. The level is pressing down as a ceiling that gets lower with each session.
The Variable the Price Chart Cannot Measure
The yield argument is the one variable in this debate that the ETH price chart cannot measure: if global bond yields are approaching a peak, the DeFi risk premium that has been compressed by rising rates begins to recover, and analytically that recovery would be expected to show up in on-chain activity before it registers in price. Van de Poppe points specifically to Japanese yields as showing signs of topping. Yield peaks across major economies would reduce the alternative return available to capital that might otherwise flow into DeFi protocols. That narrowing gap between risk-free rates and DeFi yields is what has made the latter less attractive through the current rate cycle, and a reversal of that gap is the macro condition van de Poppe’s accumulation thesis depends on.
This argument operates on a different timescale from PelinayPA’s triangle target. A yield peak thesis plays out over months, not sessions. If the CLARITY Act passes a full Senate vote in June as van de Poppe expects and bond yields show confirmed topping patterns in the same window, the macro conditions he identifies will have materialized within the timeframe the current ETH price structure is still resolving. If yields remain elevated and the triangle breakdown accelerates toward $1,350 before either catalyst arrives, the accumulation thesis will have been correct about the zone but wrong about the timing.
The information provided in this article is for educational purposes only and does not constitute financial, investment, or trading advice. Coindoo.com does not endorse or recommend any specific investment strategy or cryptocurrency. Always conduct your own research and consult with a licensed financial advisor before making any investment decisions.

Kosta has reported on cryptocurrency markets and blockchain infrastructure since 2020, bringing over six years of hands-on experience in the crypto industry built through daily tracking of markets, trends, and emerging blockchain developments. Specializing in Bitcoin on-chain analysis, institutional ETF flows, and digital asset price action, his work at Coindoo has been cited by other news agencies and consistently covers market developments with a focus on data-driven reporting across Bitcoin, Ethereum, Solana, and XRP. Over the years, Kosta has contributed to multiple crypto media outlets in different regions, authoring over 6,000 articles across the sector. His reporting spans cryptocurrency markets and the broader fintech industry, tracking not only price action but also the technological and regulatory forces shaping the ecosystem. To support his analysis, Kosta actively leverages on-chain data and metrics from leading platforms such as Santiment, Glassnode, and CryptoQuant, enabling deeper, evidence-based market insights. He believes in the power of transparency and the data that underpins the blockchain ecosystem. His academic background in Marketing Management from Denmark further complements his analytical approach, adding a strong understanding of communication strategy and content positioning to his work.