XRP Selling Pressure Is Easing, But Something Is Still Missing

XRP is trading at $1.37 on the 1-hour chart, losing 6% for the week, while two separate on-chain readings published within hours of each other describe the same week differently.
Key Takeaways
- Bybit deposit wave ended around May 16.
- Institutional accumulation indicator at -0.0059, near neutral but still negative.
- Both readings cover the same period and point in opposite directions.
- SMA50 at $1.3762, only $0.0055 above current price: nearest 1H resistance.
- RSI at 52.84, signal at 38.4.
What Taha’s flow data shows and what Arab Chain’s accumulation model shows
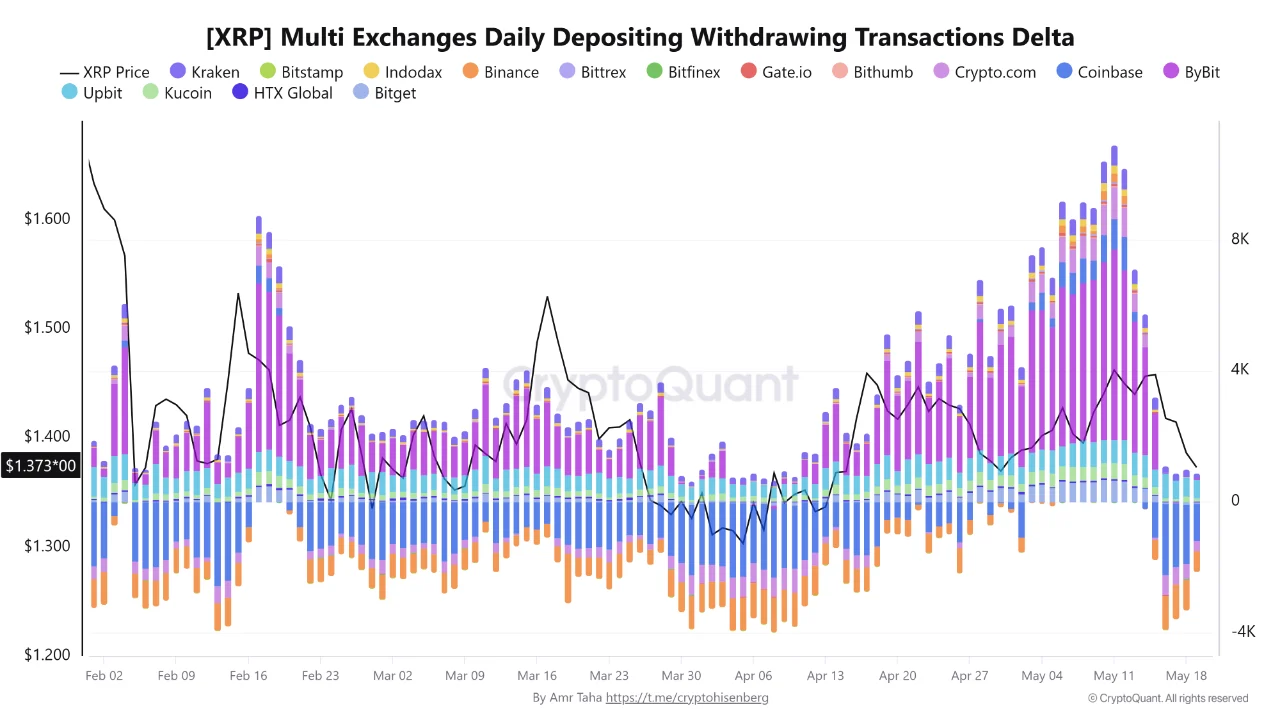
According to analysis of CryptoQuant’s Multi-Exchange Daily Depositing and Withdrawing Transactions Delta, Bybit’s transaction delta returned close to zero around May 16. That marked the end of a month-long period of consistent deposit dominance running from mid-April through mid-May. Simultaneously, Binance and Coinbase have moved into negative territory on the same metric, meaning withdrawal transactions are now outweighing deposits on both exchanges. Taha flags his own caveat: the metric tracks transaction delta, not total token volume, so it does not confirm the exact amount of XRP moving in either direction.
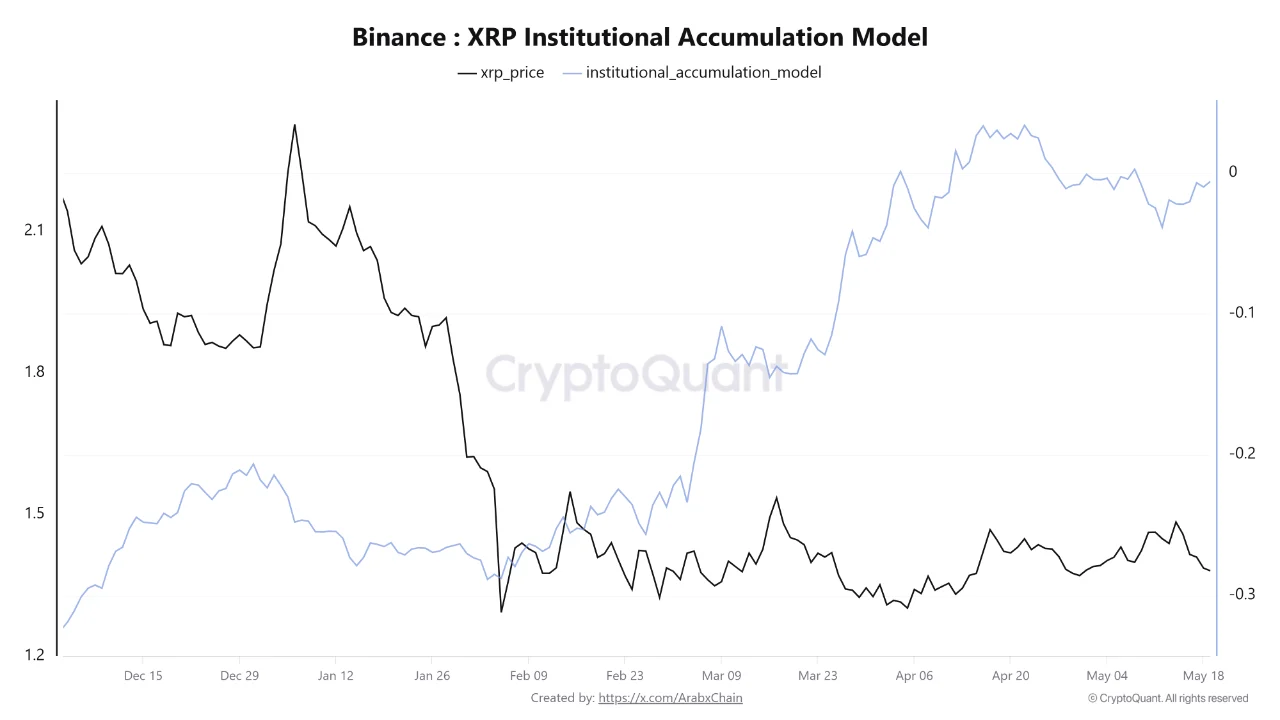
Arab Chain’s reading of the Binance XRP Institutional Accumulation Model shows the indicator at approximately -0.0059, returning to negative territory after a period of positive readings during April when XRP rose toward $1.45. The source notes the index remains close to neutral and has not entered strong distribution territory, but the direction of the move is away from the accumulation readings seen in late March and April.
The absence of selling pressure and the presence of buying are not the same condition, and the gap between what Taha’s flow data shows and what Arab Chain’s accumulation model shows is exactly that distinction. Taha’s metric describes what is happening at the exchange transaction level: deposit pressure has cooled. Arab Chain’s metric describes what institutional participants are doing with their capital: they are not actively accumulating. A market where selling pressure has eased but buying has not returned is a market waiting for a catalyst, not one that has found a floor.

Why the SMA50 is the only resistance that matters right now
At $0.0055 above current price, the SMA50 is the nearest resistance on the 1H chart and the first level price must reclaim before the hourly structure shifts from recovery to trend, but a declining SMA50 that price approaches from below is a moving target that gets easier to reach with each passing hour. The SMA100 at $1.3948 sits $0.0241 above current price. The SMA200 at $1.4230 sits $0.0523 above. All three are declining and price is below them.
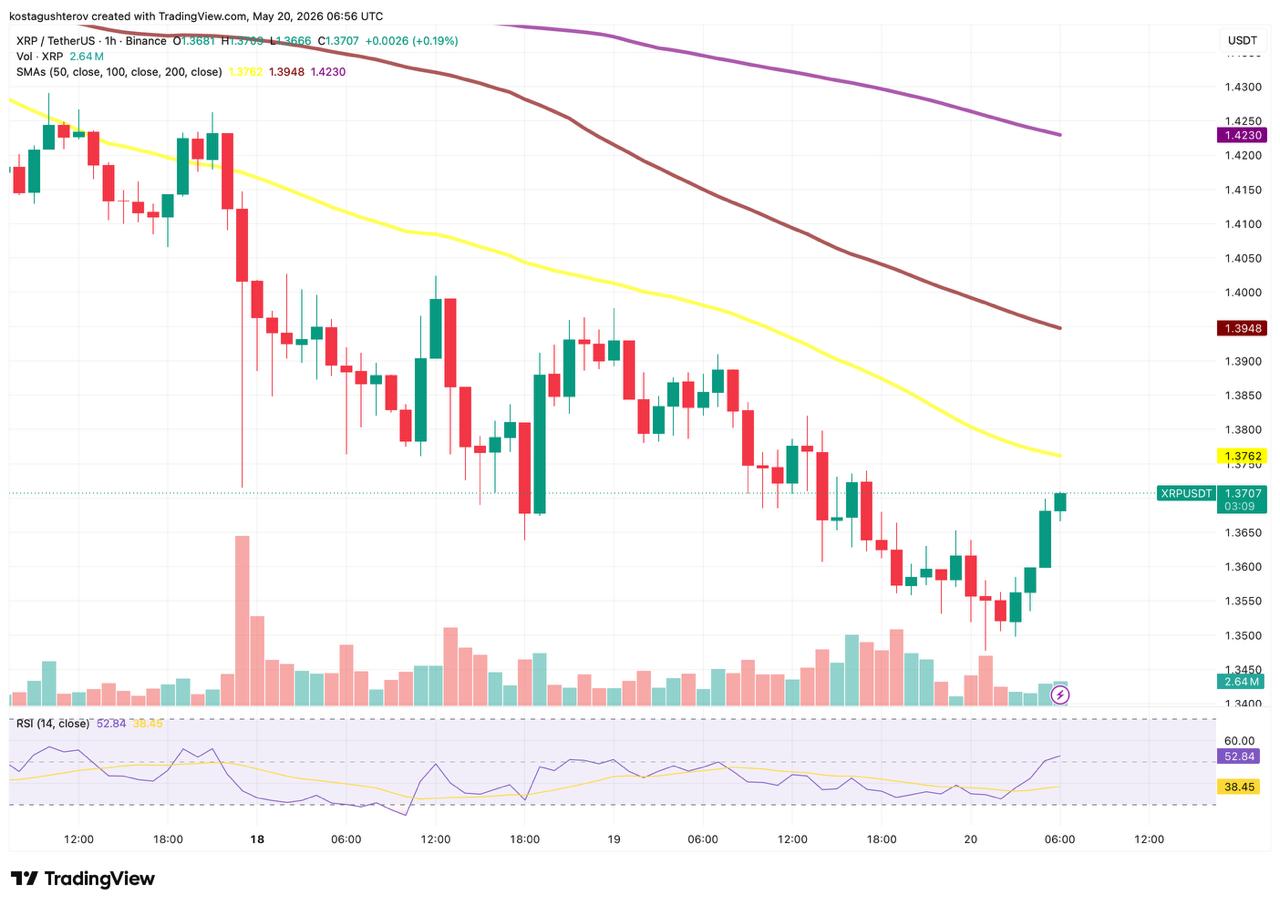
The 1H chart shows a sharp drop on May 18 from approximately $1.41 to near $1.345, followed by a recovery that has brought price back toward the $1.37 zone at the time of writing. The SMA50 is the first obstacle that recovery meets.
What the RSI adds and what it does not settle
An RSI of 52.84 crossing 14 points above its signal line marks the clearest momentum shift on the hourly chart since the May 18 drop, but momentum turning positive at a price still below all three MAs is the beginning of a recovery case, not its confirmation. The signal line at 38.45 sits well below the RSI. Analytically, that gap tends to narrow as the signal line catches up to recent price action rather than the RSI pulling back, though the speed of that convergence depends on whether the current recovery holds.
If XRP closes above the SMA50 at $1.3762 on the 1H chart within the next four hours and the institutional accumulation indicator returns to positive territory in Arab Chain’s next published reading, both the price structure and the on-chain buying signal will have aligned. If the SMA50 holds as resistance and the accumulation indicator remains negative through the week, the flow improvement Taha identifies will have been a pause in selling rather than the beginning of renewed institutional demand.
The information provided in this article is for educational purposes only and does not constitute financial, investment, or trading advice. Coindoo.com does not endorse or recommend any specific investment strategy or cryptocurrency. Always conduct your own research and consult with a licensed financial advisor before making any investment decisions.

Kosta has reported on cryptocurrency markets and blockchain infrastructure since 2020, bringing over six years of hands-on experience in the crypto industry built through daily tracking of markets, trends, and emerging blockchain developments. Specializing in Bitcoin on-chain analysis, institutional ETF flows, and digital asset price action, his work at Coindoo has been cited by other news agencies and consistently covers market developments with a focus on data-driven reporting across Bitcoin, Ethereum, Solana, and XRP. Over the years, Kosta has contributed to multiple crypto media outlets in different regions, authoring over 6,000 articles across the sector. His reporting spans cryptocurrency markets and the broader fintech industry, tracking not only price action but also the technological and regulatory forces shaping the ecosystem. To support his analysis, Kosta actively leverages on-chain data and metrics from leading platforms such as Santiment, Glassnode, and CryptoQuant, enabling deeper, evidence-based market insights. He believes in the power of transparency and the data that underpins the blockchain ecosystem. His academic background in Marketing Management from Denmark further complements his analytical approach, adding a strong understanding of communication strategy and content positioning to his work.