Ethereum May Have Found Its Bottom: The MA 50 Is Still in the Way

Ethereum is holding its long-term ascending trendline from 2022 on the monthly chart, but the MA 50 above price remains the obstacle that could decide everything.
Key Takeaways
The Long-Term Structure Is Still Alive
The monthly chart of Ethereum shows something that is difficult to ignore. The ascending support line formed in 2022 continues to hold price to this day. That line stopped the latest significant decline and triggered a strong upward reaction. This matters because at every major selloff from the highs in recent years, Ethereum has first formed a bottom around that structure before beginning a new recovery. A similar pattern is visible now.
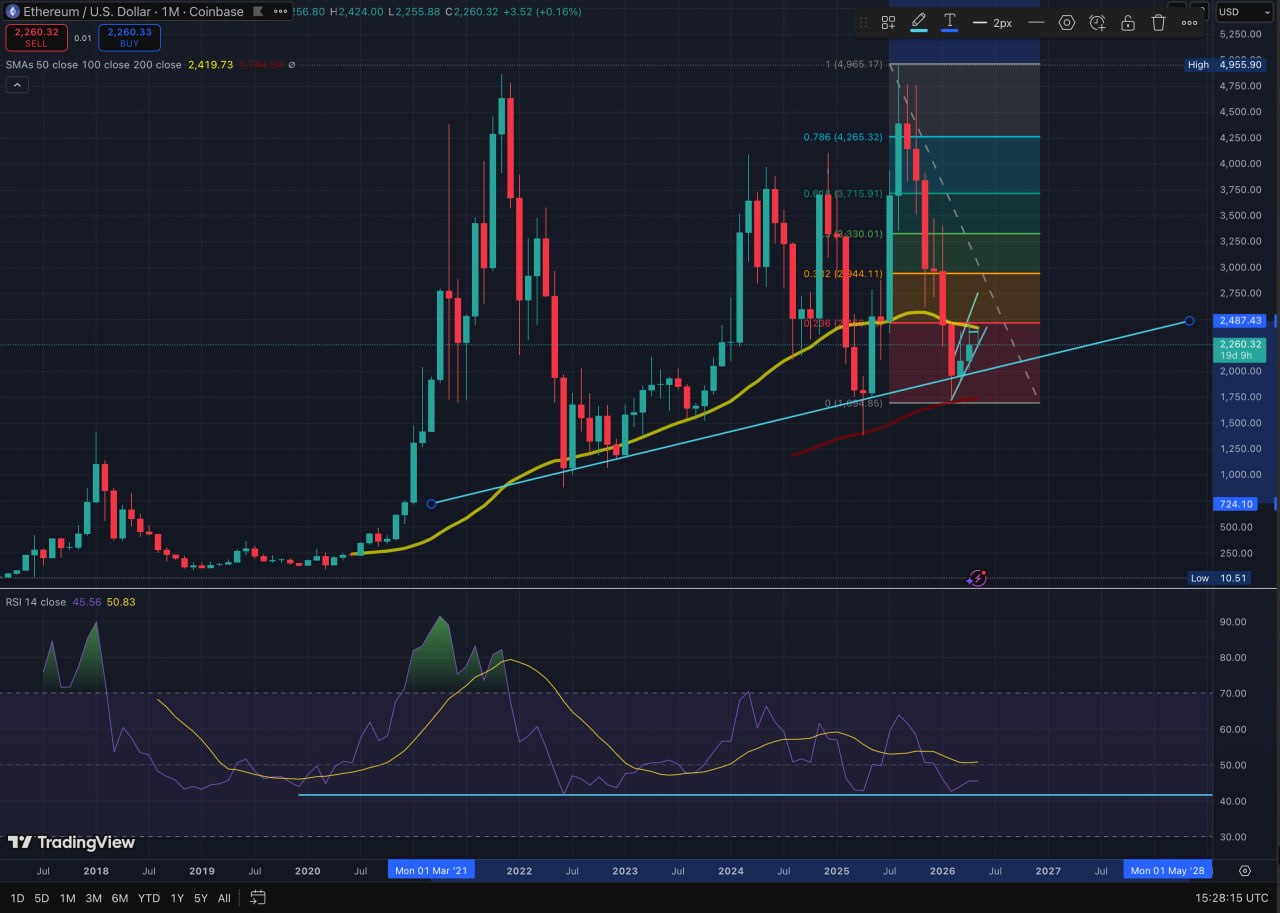
After the sharp decline from the peaks near $4,800, price returned to the long-term ascending line and is holding it so far. This is the primary reason part of the market is beginning to view the current zone as a potential macro bottom for Ethereum. Particularly important is that this is a monthly chart — a timeframe at which supports of this kind carry significantly more weight than short-term movements on the daily or weekly.
The MA 50 Remains the Main Obstacle
Despite the stable support below price, Ethereum has not yet resolved its primary problem. The 50-period moving average continues to act as key resistance and is currently limiting attempts at a more meaningful recovery. The chart clearly shows how price manages to bounce off the ascending line but struggles as it approaches the MA 50. That turns the zone around the moving average into the most important technical level for the coming months.
Historically, long-term moving averages of this kind have often separated recovery phases from prolonged bear markets. If Ethereum manages to break and hold above the MA 50 on a monthly basis, that would be the first stronger signal that downward pressure is beginning to gradually weaken. The next significant resistances on the chart sit around the Fibonacci 0.382 level at approximately $2,944 and the 0.5 level at approximately $3,715. Those zones will likely be the next major tests for price in a stronger recovery scenario.

Why the Support Below Price Remains So Important
The strongest argument in favor of Ethereum right now remains the structure below price. Instead of a sharp collapse below the long-term ascending line, the chart continues to form higher lows relative to prior major corrections. That is one of the primary signs that the broader ascending structure has not yet been fully broken.
The RSI is also beginning to gradually stabilize after the long decline from the peaks. The indicator remains far below the extreme overbought levels observed during prior cycle tops, and historically such zones tend to appear closer to market bottoms than to tops. Of course, this alone does not guarantee that Ethereum has already found its final bottom. While price remains below the MA 50, the market is still in a zone of uncertainty and the risk of renewed downward pressure remains real. But for now, the monthly structure continues to suggest that Ethereum is still defending its most important long-term support since 2022.
The information provided in this article is for educational purposes only and does not constitute financial, investment, or trading advice. Coindoo.com does not endorse or recommend any specific investment strategy or cryptocurrency. Always conduct your own research and consult with a licensed financial advisor before making any investment decisions.

Alexander Zdravkov is a market analyst and crypto journalist with interests in economics, broader financial markets and digital assets. His journey into crypto began more than four years ago, driven by a fascination with the rapid evolution of blockchain technology and the transformative potential of decentralized finance. He began analyzing market cycles and identifying emerging trends before they reach the mainstream. He holds a degree in International Relations - a background that helped shape his broader perspective on global economics, geopolitics, and the interconnected nature of modern financial markets. Whether covering the latest developments in the crypto sector or exploring broader macroeconomic themes, Alexander focuses on giving readers context rather than simply repeating headlines. During his career, he has authored more than 10,000 articles covering cryptocurrencies, traditional finance, and global market developments. His work spans everything from Bitcoin and altcoins to macroeconomic trends influencing risk assets worldwide.