Ethereum Dips to $1.5K, Stops $33 Above Its 2026 Low
Ethereum dipped to $1,538 on Saturday, stopping $33 above its June low and erasing almost all of the summer rally that carried it to $2,803 in September.
Key Takeaways
- About 90% of the summer rally erased.
- The June floor faces its third test.
- RSI near 20, matching the June washout.
Ether futures liquidations reached $545 million over 24 hours as the wider market sold off, according to CoinGlass data cited by CoinDesk.
How Much of the Summer Rally Is Left?
Very little. ETH climbed from a June low near $1,505 to $2,803 in late September, and in under two months it has given nearly all of it back. At $1,628, about 90% of that advance is gone, and Saturday’s low at $1,538 had erased 97% of it before buyers stepped in. From the September high, ETH is down about 42%.
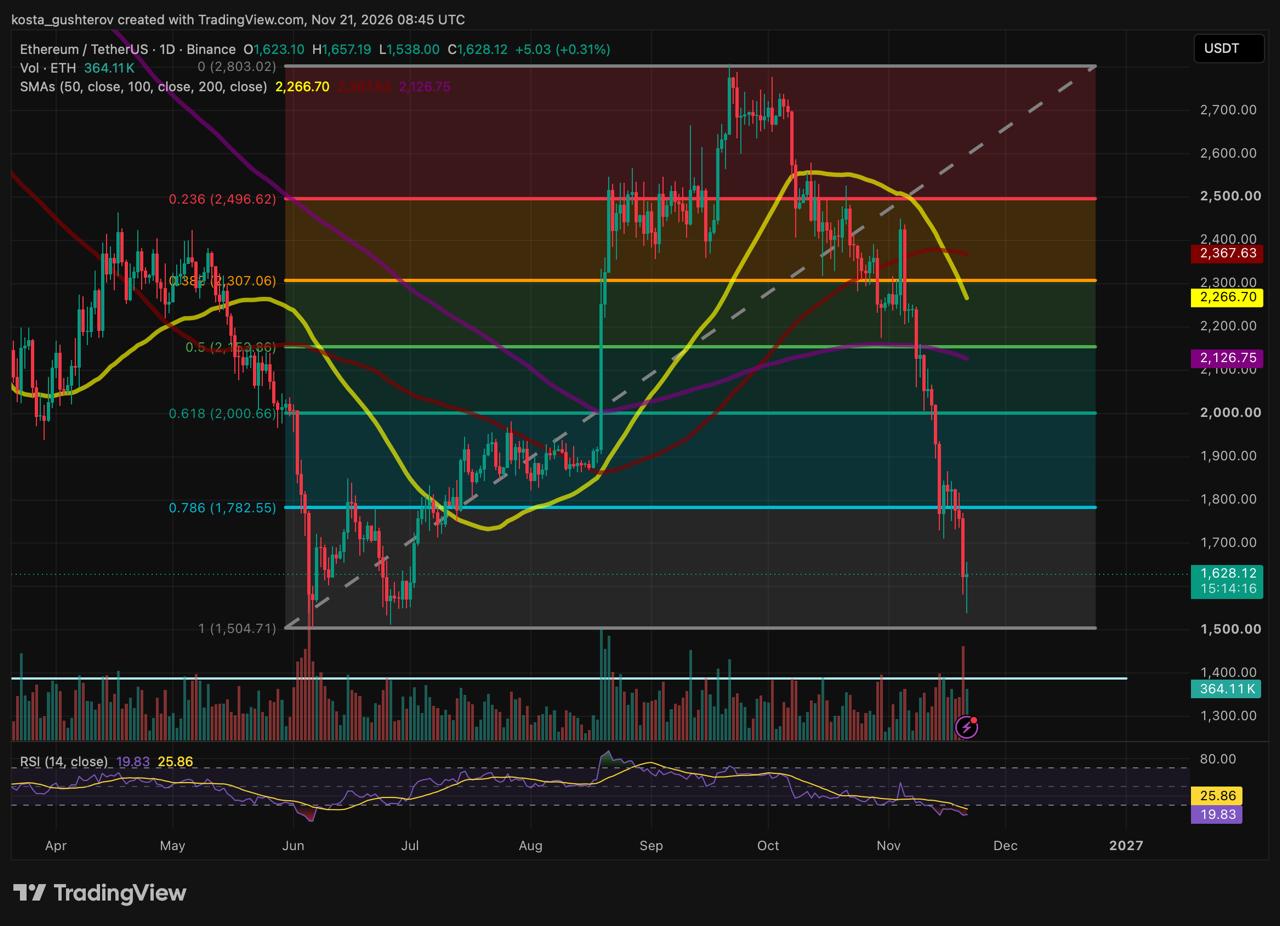
The way Saturday’s session has traded so far matters more than the low itself. ETH opened near $1,623, dropped to $1,538, and then recovered to $1,628, up 0.31% on the day as of 08:45 UTC, with about 15 hours left. That leaves a long lower wick, the first sign this week that buyers are willing to defend a level. It won’t count as a signal unless the candle closes that way.
Why Does the June Low Carry So Much Weight?
Because the market has tested it before and it held each time. The first test came in early June, when ETH crashed to about $1,505 on the heaviest volume of that period, with daily RSI deep in oversold territory. The second came in late June, when price dipped back to just above $1,500 and held again. The rally to $2,803 started from that double test.
Near $1,505 · held
Just above $1,500 · held
Low $1,538 · in progress
The current approach rhymes with June in two ways. Daily RSI is at 19.83, back in the same washed-out range it reached at the June low, and still under its own average at 25.86. Friday’s selling came on one of the heaviest volume bars since the June crash. A floor that holds a third time can become the base of a larger bottom. A floor that keeps getting retested can also wear down, because every bounce from it absorbs some of the buying behind it.
Below the June low, the next reference is the April 2025 low near $1,395, the deepest point of the previous correction.
Why Did Bitcoin Break Its Floor While ETH Kept Its Own?
On Saturday, bitcoin fell through its 2026 low near $57,700 and traded at $55,130, its lowest since September 2024. ETH didn’t break its 2026 low, even though it has fallen harder: about 42% from its September high, against roughly a third for bitcoin.
The difference is where each floor sits. ETH’s June crash went much deeper than bitcoin’s summer dip, so ETH’s 2026 low sits further below the recent range. That gave ETH more room to fall before reaching it. ETH’s floor is intact for now, but bitcoin losing its own one leaves ETH testing support in a market where the largest asset has already broken down.
What Is Pressing From Above?
The overhead levels form four clusters, and each one is a place where the next bounce could stall. Tap or click a level for the detail.
Near $1,783: the level that broke in mid-November
Near $2,000: the round number
$2,127–$2,154: the 200-day and the midpoint
$2,267–$2,368: the shorter averages
The averages show the trend. The 50-day is falling fastest and has already crossed under the 100-day, while the 200-day has only just started to roll over. Until price gets back above at least the first cluster, every rally runs into levels where recent buyers are underwater.
What Is the Largest Holder Doing?
Bitmine, the Tom Lee-chaired company that holds more ETH than any other public firm, has kept buying through the decline. Its latest weekly update showed 6,077,745 ETH, about 4.97% of supply, valued at roughly $11.1 billion at $1,823 on November 15. At Saturday’s price, the same stake is worth about $9.9 billion. Lee called the drop a “waterfall decline in price” that doesn’t reflect Ethereum’s fundamentals, The Block reported. The company has bought every week since mid-2025, and its next update will show whether it added on this week’s slide toward the June low.
Where Is the Line Drawn?
ETH sits about 8% above its June low and about 9% below the level it lost in mid-November.
This article is for informational purposes only and is not financial, investment or trading advice. Cryptocurrencies are highly volatile; do your own research before making any decision.



Alexander Zdravkov is a market analyst and crypto journalist with interests in economics, broader financial markets and digital assets. His journey into crypto began more than four years ago, driven by a fascination with the rapid evolution of blockchain technology and the transformative potential of decentralized finance. He began analyzing market cycles and identifying emerging trends before they reach the mainstream. He holds a degree in International Relations - a background that helped shape his broader perspective on global economics, geopolitics, and the interconnected nature of modern financial markets. Whether covering the latest developments in the crypto sector or exploring broader macroeconomic themes, Alexander focuses on giving readers context rather than simply repeating headlines. During his career, he has authored more than 5,000 articles covering cryptocurrencies, traditional finance, and global market developments. His work spans everything from Bitcoin and altcoins to macroeconomic trends influencing risk assets worldwide.