NEAR Sinks 12% Onto Its 200-Day SMA: Three Paths Ahead

NEAR was down almost 12% on Friday, falling out of the narrow band it was squeezed into two days ago and stopping just above its rising 200-day average.
Key Takeaways
- Friday’s high stopped under the 0.618 level.
- Price sits about 3% above the 200-day.
- RSI near 31.7, not yet oversold.
- Heavy selling volume, two hours before the close.
Two days ago, Coindoo’s analysis of NEAR’s three-level squeeze marked the 0.618 retracement near $3.23 as the floor of a 29-cent band. Friday’s candle ended that setup.
Out of the Bottom of the Band
NEAR traded at $3.34 when that analysis ran, with the 0.618 below, the 100-day average above and the upper edge of its descending channel pressing down on price.
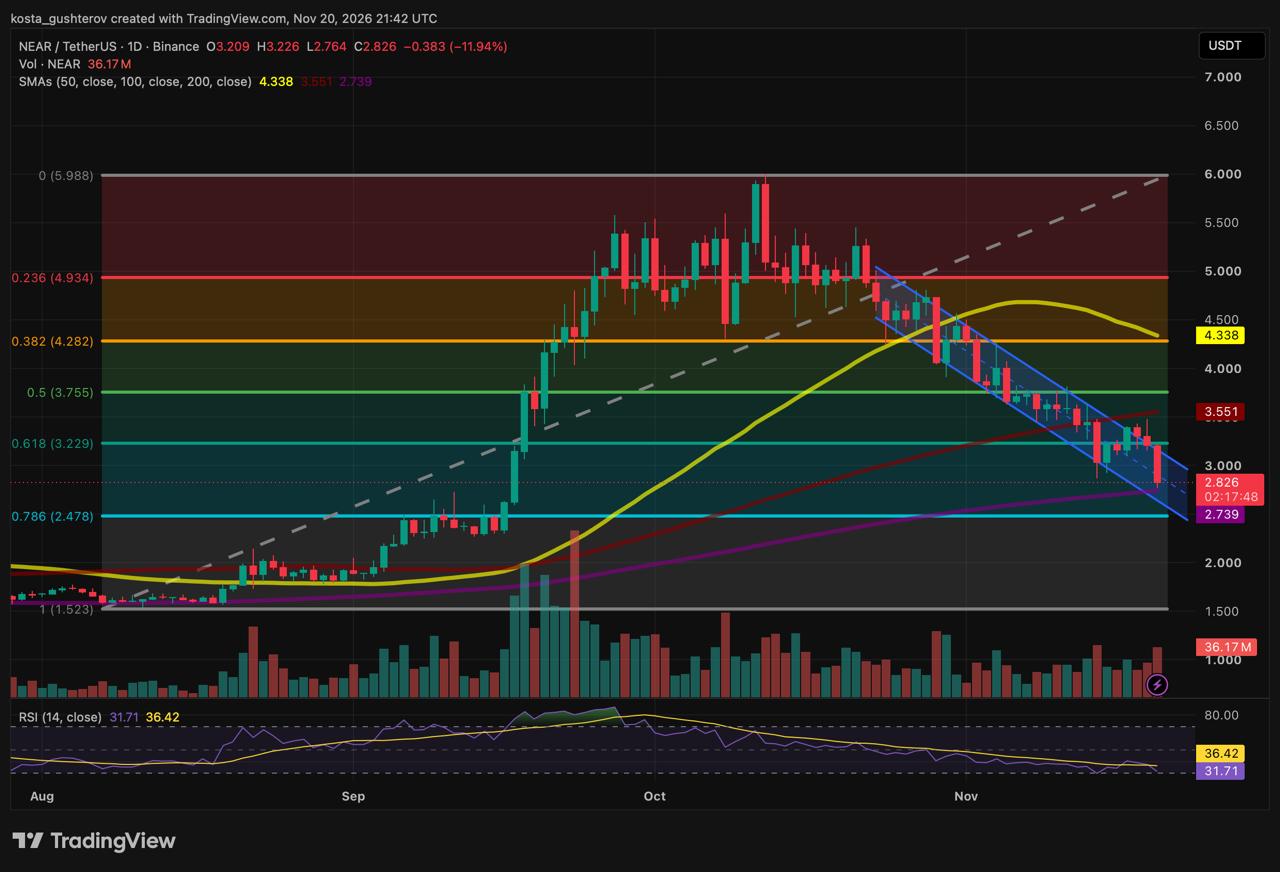
On Thursday, a push higher poked above the channel line and then closed back inside, at $3.21, just under the 0.618. Friday opened at that level and reached $3.226, less than a cent below the 0.618 at $3.229, before the selling started. The low came at $2.76. As of 21:42 UTC, with about two hours left in the session, NEAR traded at $2.83, down 11.94% on the day and about 15% below where it stood on November 18. The drop came as the broader crypto market sold off.
Resting on the 200-Day
The November 18 piece laid out what losing the 0.618 would expose: the rising 200-day average, then the 0.786 retracement beneath it. NEAR is now at the first of those. The 200-day has crept up from $2.72 to $2.74 since then, and Friday’s low stopped just above it.
The averages above price point in different directions. The 50-day, at $4.34, is falling and sits near the 0.382 retracement at $4.28, making that the highest resistance band on the chart. The 100-day at $3.55 is still rising, as is the 200-day. There has been no bearish crossover between any of them yet, but the 50-day has dropped about eight cents in two days and is closing in on the 100-day from above. NEAR now trades 53% below its mid-October high near $5.99.
Inside the Channel
The descending channel that began in late October is still intact. Every rally since then has stopped at its upper line, Thursday’s included, and Friday’s high came where that line runs just under the 0.618. Price now sits in the lower half of the channel. The channel’s lower line runs below the 200-day and is sloping down toward the 0.786 level, so the two will be close together within days if the channel holds its shape.
What Sits Below the 200-Day
The levels under the 200-day map to two phases of the rally. The 0.786 near $2.48 sits in the September shelf where NEAR traded between $2.40 and $2.50 before its mid-September breakout. $2.20 sits at the lower part of that consolidation. The full retracement near $1.52 marks the August low the whole Fibonacci grid starts from.
Three Ways From Here
For now, the nearest support is the 200-day, about 3% below price, and the nearest resistance is the 0.618, about 14% above.
Chart: NEAR/USDT daily, Binance, via TradingView, captured November 20, 2026, at 21:42 UTC with the daily candle still open. The Fibonacci retracement is drawn from the August low to the mid-October high.
This article is for informational purposes only and is not financial, investment or trading advice. The levels and scenarios describe chart conditions, not price predictions. Cryptocurrencies are highly volatile; do your own research before making any decision.



Kosta has reported on cryptocurrency markets and blockchain infrastructure since 2020, bringing over six years of hands-on experience in the crypto industry built through daily tracking of markets, trends, and emerging blockchain developments. Specializing in Bitcoin on-chain analysis, institutional ETF flows, and digital asset price action, his work at Coindoo has been cited by other news agencies and consistently covers market developments with a focus on data-driven reporting across Bitcoin, Ethereum, Solana, and XRP. Over the years, Kosta has contributed to multiple crypto media outlets in different regions, authoring over 6,000 articles across the sector. His reporting spans cryptocurrency markets and the broader fintech industry, tracking not only price action but also the technological and regulatory forces shaping the ecosystem. To support his analysis, Kosta actively leverages on-chain data and metrics from leading platforms such as Santiment, Glassnode, and CryptoQuant, enabling deeper, evidence-based market insights. He believes in the power of transparency and the data that underpins the blockchain ecosystem. His academic background in Marketing Management from Denmark further complements his analytical approach, adding a strong understanding of communication strategy and content positioning to his work.