Zcash Price Crashes Through $800 With Little Support Below
Zcash was down almost 15% on Friday, cutting below its 200-day average and the 0.618 Fibonacci retracement in a single session, both near the $800 mark.
Key Takeaways
- Mid-November support near $800 gave way.
- Bounce stalled at the 0.5 level near $975.
- 50-day average falling fast toward the 100-day.
- RSI just under 30, no capitulation volume.
Friday’s drop came as part of a broader selloff across the crypto market.
A 15% Candle Through the $800-$810 Zone
ZEC opened Friday near $894, reached $899 and then fell as low as $746. As of 19:36 UTC, with more than four hours left in the session, it traded near $763, down 14.67%. That puts price under two levels that sit almost on top of each other: the 200-day simple moving average at $810 and the 0.618 retracement near $800.
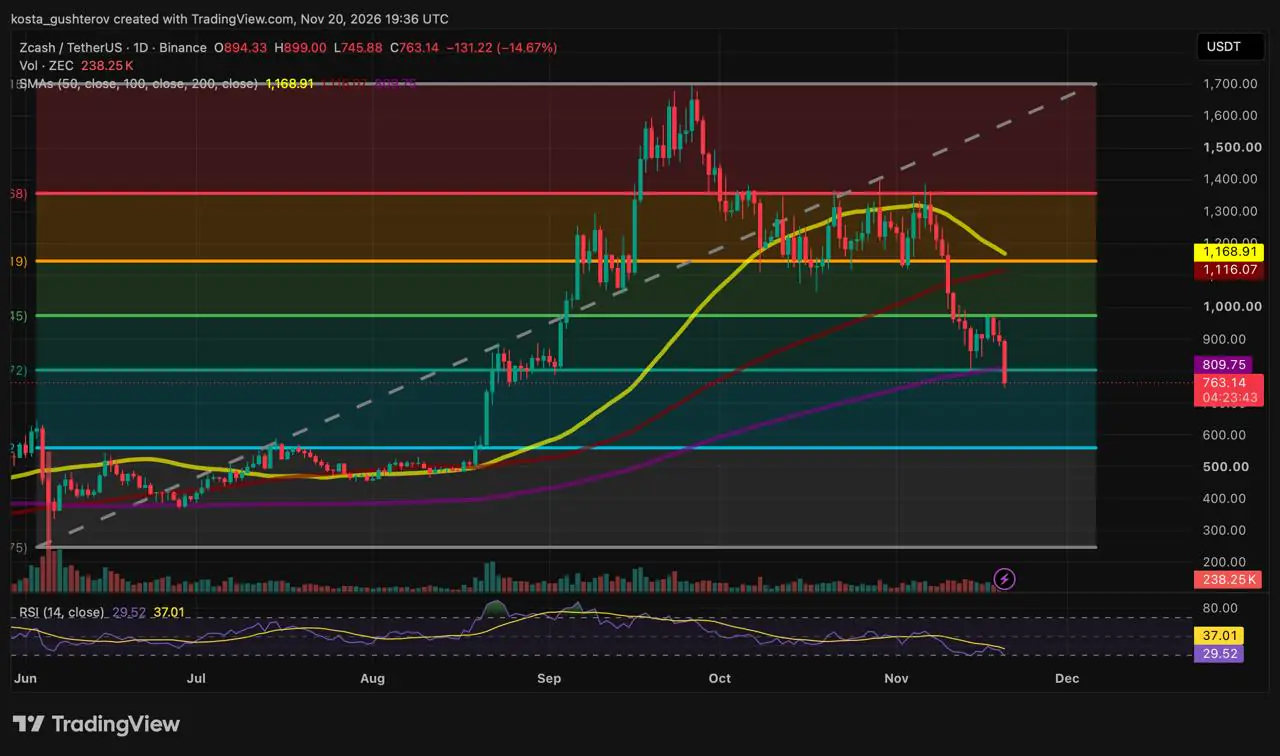
The zone had already been tested once. ZEC’s first leg down in mid-November stopped just above it, and buyers pushed price back up from there. When ZEC traded near $921 earlier this week, Coindoo’s weekly chart analysis named the 200-day as the nearest daily support if the weekly channel floor gave way. On Friday the candle went straight through it, taking ZEC to prices it last traded at in late August.
How the Decline Built
Each support has also held for less time than the one before. The October range kept ZEC up for about five weeks. The mid-November low lasted about one.
Little Trading History Below $746
Friday’s low near $746 marks the bottom of the area where ZEC paused after its August breakout. Below it, the climb from about $550 to $800 happened so fast that the chart has almost no closes in between. That’s why the next labeled support sits as far down as the 0.786 retracement near $560.
Averages Overhead, Momentum Just Turning Oversold
ZEC has now lost all three daily averages, one at a time: the 50-day in October, the 100-day in the mid-November break and the 200-day, at $810, on Friday. Higher up, the 50-day at $1,169 is falling fast toward the 100-day at $1,116, which is still rising but flattening. The 0.382 retracement near $1,145 sits between the two, which makes $1,116-$1,169 the densest resistance band on the chart. The 50-day is still above the 100-day, but the gap between them has narrowed sharply since early November.
The 14-day RSI reads 29.52, just under the 30 line that marks oversold territory and well below its own average at 37.01. It has only just crossed that threshold: a fresh oversold reading, not a deep one.
Volume reads 238.25K ZEC with more than four hours left in the session, small next to the spikes that marked the June low and the late-August breakout. Nothing on the chart yet resembles the volume of a washout.
What the Daily Close Sets Up
That leaves ZEC with resistance about 6% above, at the 200-day average, and the next labeled support about 27% below, near $560.
This article is for informational purposes only and is not financial, investment or trading advice. The levels and scenarios describe chart conditions, not price predictions. Cryptocurrencies are highly volatile; do your own research before making any decision.



Alex is Editor-in-Chief of Coindoo and co-founder of Millennial Media Group, with nearly a decade of experience covering financial markets - crypto first, then everything else. It started in 2016 with Bitcoin. Like most people at the time, he didn't fully understand it - so he kept digging. Blockchain, tokenomics, the projects, the cycles. That curiosity never stopped, and eventually pulled him into traditional markets too: equities, commodities, macro. Not because he left crypto behind, but because you can't properly understand one without the other. What drives him is straightforward: he wants to know why something is happening, not just that it's happening. Most market coverage stops at the headline - price up, price down, here's a chart. Alex finds that kind of reporting actively unhelpful. If you walk away from an article without understanding the mechanism behind the move, what did you actually learn? He holds a degree in Tourism from New Bulgarian University - not the most obvious path into financial markets, but markets have a way of pulling in people who are simply too curious to stay out. He has authored over 200 in-depth analyses and more than 10,000 articles across crypto and traditional finance. He still thinks every day in markets teaches him something new. That's probably why he hasn't stopped.