Solana Price Loses Its Summer Floor, June Low Back in View
Solana was down more than 6% on Friday after failing to get back above the level that anchored its summer range, leaving the June low as the next labeled support.
The Level SOL Couldn’t Keep
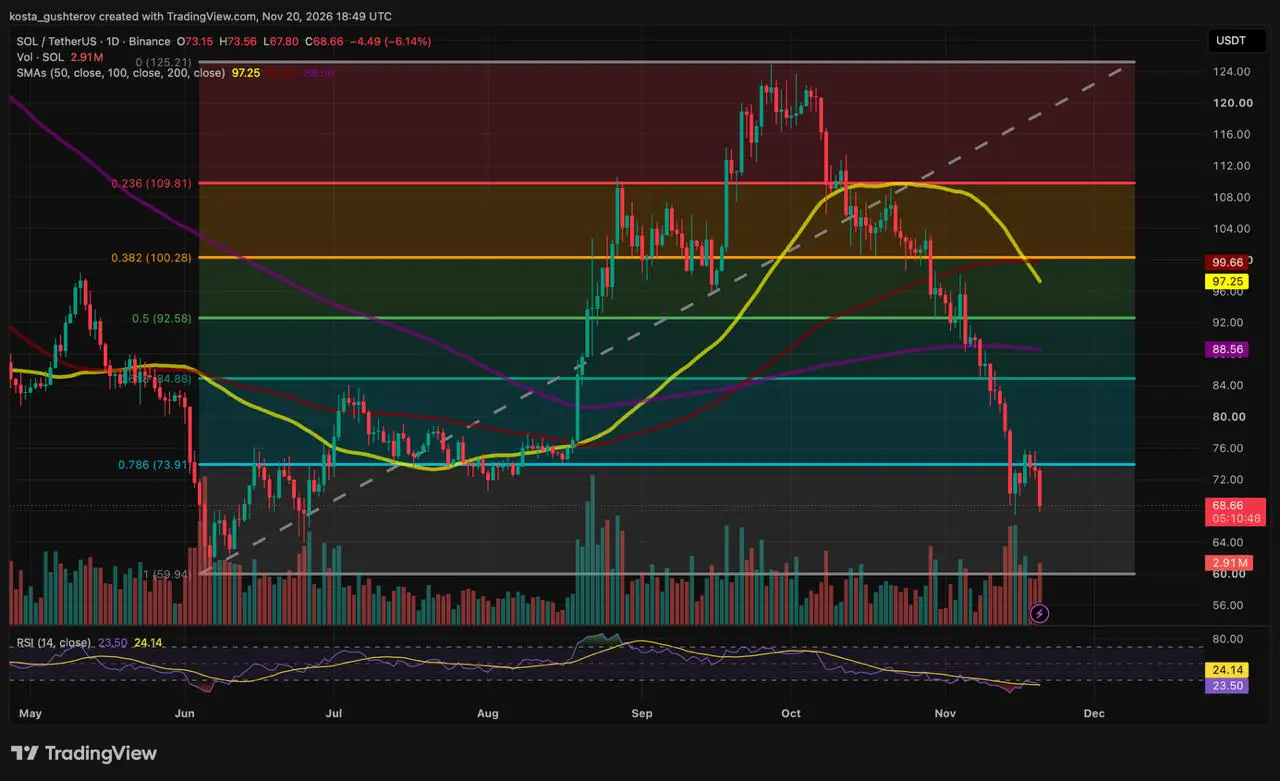
When SOL traded near $79 a week ago, Coindoo’s November 13 analysis flagged the 0.786 Fibonacci retracement near $74 as the last level above $60. This week’s trading has revolved around that line. SOL broke below it within days, then closed back above it on November 17, near $75, for a single session. It slipped under the level again over the next two days, and Friday’s candle opened just below it, near $73. The high stopped roughly 35 cents short of the level before sellers pushed price to an intraday low near $68. As of 18:49 UTC, with about five hours left in the session, SOL traded near $69, down 6.14%.
The November 17 close also raises the bar for any recovery. One close above $75 has already happened and reversed within a day, so a reclaim that counts would need to hold for more than one session.
From Floor to Ceiling
The same level played the opposite role a few months ago.
87% of the Summer Rally Is Gone
Measured from the June low near $60 to the late-September peak at $125, SOL has given back about 87% of the rally and sits 45% below the high. Above price, the 0.618 retracement near $85 and the 200-day average at $89 sit close together, forming the next resistance band after the 0.786 level. Below, the full retracement near $60 is the only labeled level left. It marks the June low that the whole Fibonacci grid is drawn from.
What June Actually Looked Like
The space between Friday’s price and the June low has trading history on it. After the early-June plunge to near $60, SOL spent weeks moving between that low and the level it is now testing from below, with long wicks in both directions and a late-June pullback into the lower part of the range. None of that range carries a labeled level on this chart, but buyers and sellers have traded there before. Friday’s low near $68 is the first line to watch. Under it, the June range is the reference all the way down to the full retracement near $60.
Averages Above, Momentum Stretched
All three daily averages sit above price: the 100-day at $100, the 50-day at $97 and the 200-day at $89. The 50-day has just slipped under the 100-day as it turns sharply lower. It is still above the 200-day, so this isn’t the 50/200 “death cross,” but SOL trades about 22% below even the lowest of the three.
Momentum points the other way. The 14-day RSI reads 23.5, well inside oversold territory, and it is still under its own average near 24.1, so it hasn’t turned up. On this chart, the only comparable reading came in early June, at the low the Fibonacci grid starts from. Readings this low can persist through a strong selloff, and they can also produce sudden short-covering spikes, so the oversold reading cuts both ways.
Volume favors the sellers, with a caveat. It spiked on the mid-November breakdown, faded during the bounce, and picked up again on Friday: 2.91 million SOL with hours still left in the session, already above the bounce days. The candle isn’t finished, though, and it is still lighter than the breakdown days.
Outside the Chart
SOL’s slide ran through a busy stretch for the network. Solana completed its move to 200-millisecond slots on October 9, halving its original 400-millisecond target, according to the Solana Foundation’s upgrade page. SOL was trading above $100 at the time. Last weekend the network dropped its “mainnet beta” label and adopted Solana 1.0 as a shared version number, a change that CoinDesk noted doesn’t make transactions faster or affect holders. The Solana Foundation’s Breakpoint conference ran in London from November 15 to 17. None of it slowed the decline, and neither did long-range valuation work such as Bitwise’s $1,100 scenario, whose assumptions run out to 2031.
Fund flows line up more closely with the chart. US spot Solana ETFs took in $271.6 million in September, as SOL rallied to its high, then saw $143.7 million in net outflows in October as the breakdown began, according to CoinDesk. On November 18, Roundhill asked the SEC to withdraw its proposed Solana covered-call ETF, which had never sold a share. Friday’s drop also came alongside the wider market: Bitcoin briefly fell tog around $59,000.
Three Ways Out
These are conditions, not a forecast. Until one of them triggers, SOL sits between a level it has failed to hold twice in a week and a low it hasn’t tested since June.



Kosta has reported on cryptocurrency markets and blockchain infrastructure since 2020, bringing over six years of hands-on experience in the crypto industry built through daily tracking of markets, trends, and emerging blockchain developments. Specializing in Bitcoin on-chain analysis, institutional ETF flows, and digital asset price action, his work at Coindoo has been cited by other news agencies and consistently covers market developments with a focus on data-driven reporting across Bitcoin, Ethereum, Solana, and XRP. Over the years, Kosta has contributed to multiple crypto media outlets in different regions, authoring over 6,000 articles across the sector. His reporting spans cryptocurrency markets and the broader fintech industry, tracking not only price action but also the technological and regulatory forces shaping the ecosystem. To support his analysis, Kosta actively leverages on-chain data and metrics from leading platforms such as Santiment, Glassnode, and CryptoQuant, enabling deeper, evidence-based market insights. He believes in the power of transparency and the data that underpins the blockchain ecosystem. His academic background in Marketing Management from Denmark further complements his analytical approach, adding a strong understanding of communication strategy and content positioning to his work.