ETH Is Stuck in a $120 Range While Its Supply Disappears

Ethereum is grinding between two Fibonacci levels with double resistance clusters above - while exchange reserves hit multi-year lows and 32% of supply stays locked in staking.
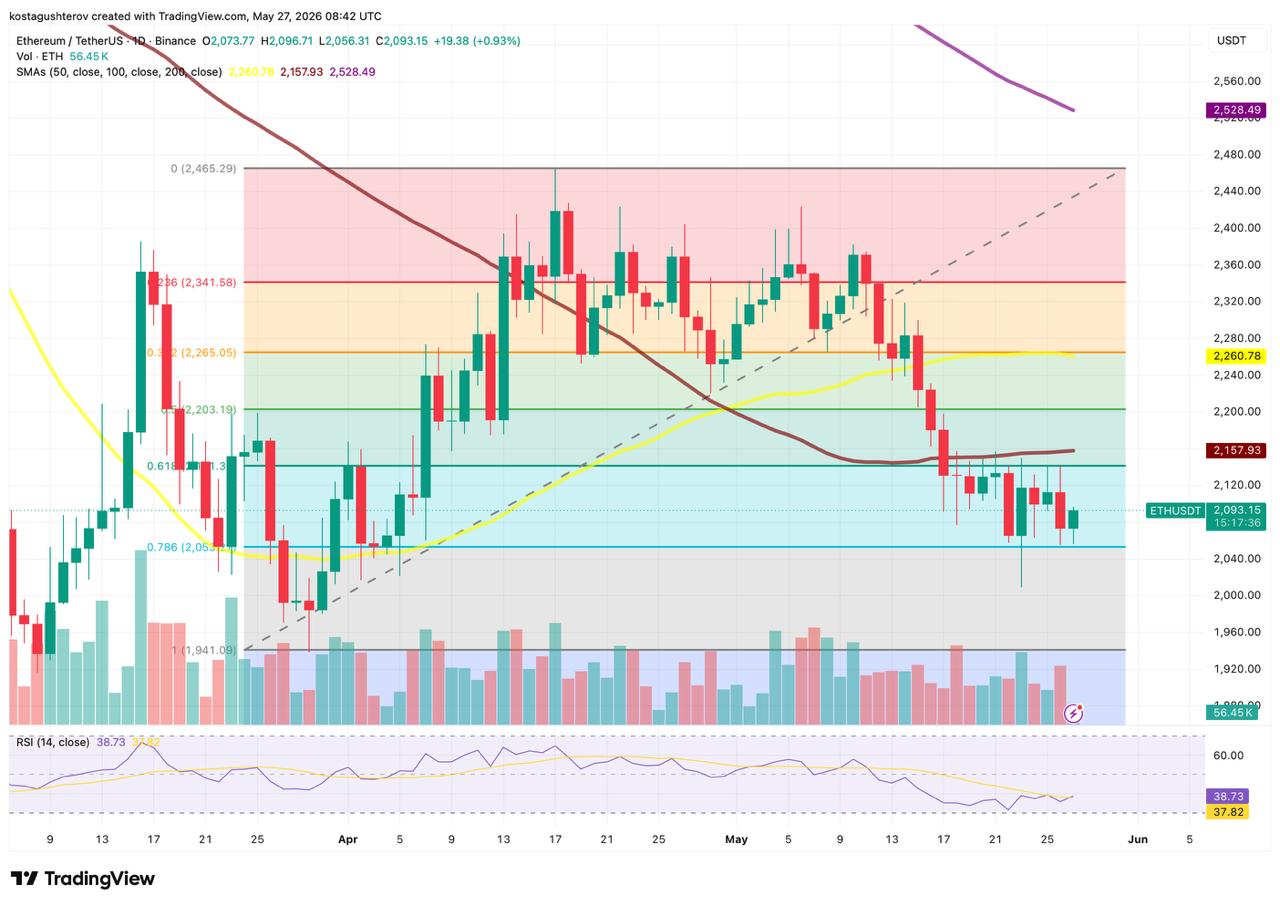
- ETH trapped between 0.786 Fib ($2,053) and 0.618 Fib ($2,171) for days.
- SMA100 at $2,157 and SMA50 at $2,260 both declining, acting as resistance.
- Exchange reserves at 14.9M ETH, lowest since 2022, down from 30M four years ago.
- 32.2% of all ETH supply locked in staking, rising consistently since 2022.
- Tom Lee accumulated 5.4M ETH through BitMine, 4.47% of circulating supply.
Ethereum is trading at $2,093 today, up 0.93%, bouncing inside a range between the 0.786 Fibonacci retracement at $2,053.27 on the bottom and the 0.618 Fib at $2,171.30 on top. That’s a $118 corridor with resistance stacked immediately above and support that if lost opens a drop to $1,941. Meanwhile the on-chain data shows the amount of ETH available to sell sitting at its lowest point since 2022. The price chart and the supply picture are pointing in opposite directions.
The range and what’s sitting above it
The Fibonacci structure on the daily chart runs from the March low at $1,941.09 to the April peak near $2,465.29. ETH recovered through April, hit the Fib 0 level and reversed, and has been retracing since. Current price at $2,093 sits between the 0.786 and 0.5 Fib levels, closer to the 0.786 support.
The resistance above current price is stacked in two clusters that sit uncomfortably close together. The SMA100 at $2,157.93 and the 0.618 Fib at $2,171.30 are $14 apart, effectively one resistance zone that price is $65 away from hitting. Clear that and the 0.5 Fib at $2,203 is the next stop, $30 above. Then the second cluster: the SMA50 at $2,260.78 and the 0.382 Fib at $2,265.05 sit $5 apart. Two double-resistance clusters within $170 of current price, with declining moving averages pushing down toward price from above at each level.
Three declining moving averages
All three SMAs are declining. The SMA50 at $2,260.78 has been falling since the April peak. The SMA100 at $2,157.93 is declining but starting to flatten — it’s almost exactly at current price, meaning ETH is trading just below its 100-day average and hasn’t managed to reclaim it. The SMA200 at $2,528.49 is the steepest of the three, falling sharply from upper left and sitting $435 above current price.
The SMA200’s direction matters more than its location. It has been declining since ETH peaked above $4,000 in late 2024 and is dropping faster than price is recovering. Every day it stays in decline it descends lower, reducing the distance to reach it but not changing what it represents. Until it flattens, every rally attempt runs into a ceiling that keeps moving lower to meet it. That’s not a static resistance. It’s a descending one.
RSI flattening near oversold
The daily RSI at 38.73 is approaching the 30 level where bounces historically become more likely on ETH. The signal line sits at 37.82, less than one point below the RSI. That near-convergence means downward momentum is flattening rather than continuing to accelerate. It’s a different read from Bitcoin’s current setup where RSI was running well below its signal. ETH’s momentum isn’t reversing yet but it’s no longer picking up speed to the downside either.
Exchange reserves at the lowest point since 2022
The CryptoQuant exchange reserve data is the most important context for reading the ETH setup. Ethereum exchange reserves currently stand at 14.9 million ETH — the lowest since 2022, down from approximately 30 million ETH four years ago. That’s a 50% reduction in exchange-held supply over four years, declining through bull markets, bear markets, and everything in between.
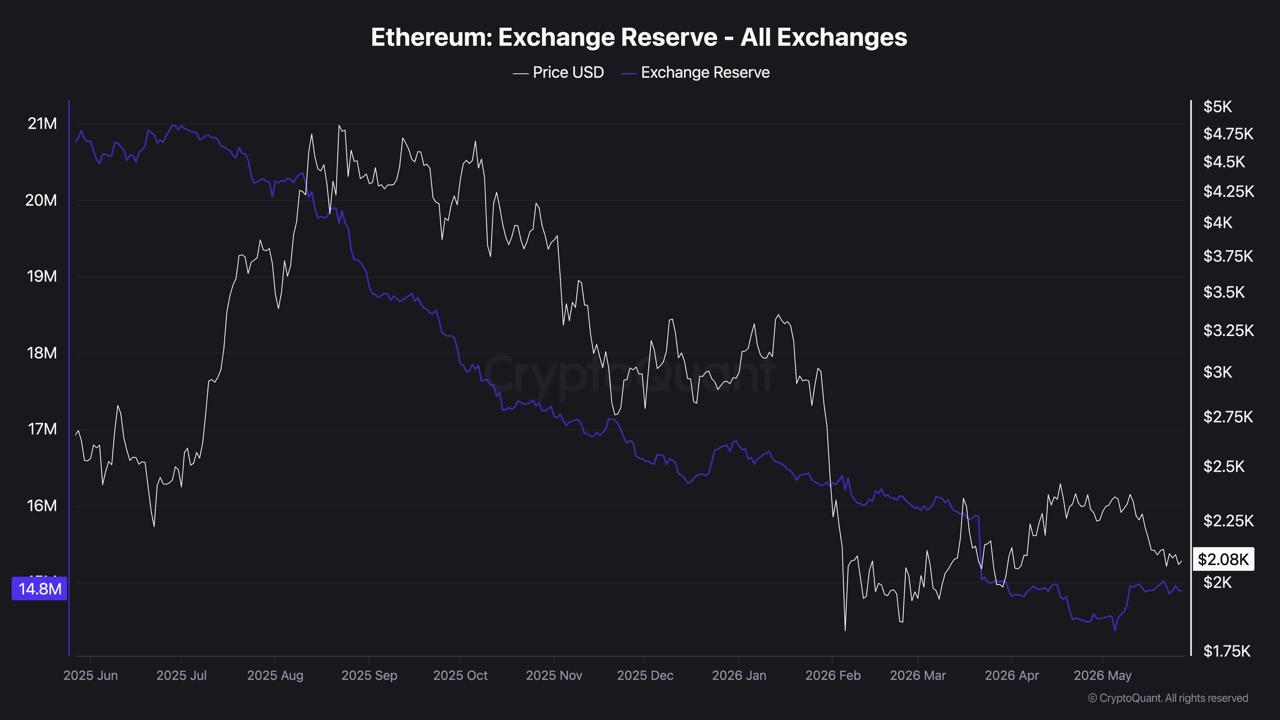
Exchange reserves measure ETH sitting in exchange wallets immediately available to sell. When reserves decline, holders are moving ETH into self-custody or staking, pulling it away from the immediately available sell-side. With total circulating supply around 120 million ETH, the 14.9 million on exchanges represents roughly 12.4% of supply immediately available for sale, compared to closer to 25% in 2022.
The staking chart compounds this. The ETH 2.0 staking rate has climbed from around 8% in mid-2022 to 32.2% today, rising consistently through every market condition since the Merge. More than 30% of all ETH supply is locked in staking contracts and unavailable for sale without going through the withdrawal process. The freely floating, immediately sellable ETH supply is structurally smaller than at any point in the past four years.
Price near yearly lows while exchange-available supply is near four-year lows is a tension the chart alone doesn’t explain. Either the remaining sell pressure is coming from holders moving coins specifically to exchanges to sell, or the macro environment is suppressing demand enough that even a tightening supply can’t hold price up.

Tom Lee is accumulating while the chart grinds lower
Tom Lee, co-founder of Fundstrat and one of Wall Street’s most prominent crypto bulls, has been building a large Ethereum position through BitMine Immersion Technologies, a publicly traded company that has adopted an ETH treasury strategy similar to how Strategy operates with Bitcoin. BitMine recently added another 111,942 ETH, bringing total holdings to 5.39 million ETH – approximately 4.47% of Ethereum’s total circulating supply in a single institutional vehicle.
Lee views ETH as digital financial infrastructure rather than a speculative asset. His thesis rests on Ethereum’s dominance in stablecoin settlement, tokenization, Layer 2 activity, and AI-driven blockchain applications.
Accumulating 4.47% of circulating supply during a period when exchange reserves are at multi-year lows and price is near yearly lows is a positioning decision, not a momentum trade. Lee is buying what the chart says to avoid.
The Ethereum Foundation appears to be selling less
Vitalik Buterin recently stated that the Ethereum Foundation should not be viewed as the center of Ethereum but as one node within a broader ecosystem. Alongside that repositioning, the foundation appears increasingly focused on minimizing ETH sales — historically one of the market’s consistent sources of sell-side supply, and concentrating resources on censorship resistance, privacy, security, and open-source infrastructure.
Some of my perspective on where the @ethereumfndn is going.
First of all, this is only my own view. The board is not just me, and I have no extra special powers on the board that the other board members do not. @aerugoettinea is the one executing much of this transition. My…
— vitalik.eth (@VitalikButerin) May 24, 2026
If the EF is indeed reducing its ETH sales, that removes one of the more predictable supply sources from the market. Combined with declining exchange reserves, a 32.2% staking rate, and institutional accumulation at scale, the supply picture has been quietly tightening while price has moved the other way.
Where ETH stands
The chart is bearish. Three declining moving averages above current price, two double-resistance clusters stacked within $170 of current levels, an SMA200 at $2,528 declining steeply as a distant ceiling, and support at $2,053 that if lost opens $1,941.
The supply picture is constructive but the $2,053 support is the line that keeps those two outcomes separated right now.
The information provided in this article is for educational purposes only and does not constitute financial, investment, or trading advice. Coindoo.com does not endorse or recommend any specific investment strategy or cryptocurrency. Always conduct your own research and consult with a licensed financial advisor before making any investment decisions.



Kosta has reported on cryptocurrency markets and blockchain infrastructure since 2020, bringing over six years of hands-on experience in the crypto industry built through daily tracking of markets, trends, and emerging blockchain developments. Specializing in Bitcoin on-chain analysis, institutional ETF flows, and digital asset price action, his work at Coindoo has been cited by other news agencies and consistently covers market developments with a focus on data-driven reporting across Bitcoin, Ethereum, Solana, and XRP. Over the years, Kosta has contributed to multiple crypto media outlets in different regions, authoring over 6,000 articles across the sector. His reporting spans cryptocurrency markets and the broader fintech industry, tracking not only price action but also the technological and regulatory forces shaping the ecosystem. To support his analysis, Kosta actively leverages on-chain data and metrics from leading platforms such as Santiment, Glassnode, and CryptoQuant, enabling deeper, evidence-based market insights. He believes in the power of transparency and the data that underpins the blockchain ecosystem. His academic background in Marketing Management from Denmark further complements his analytical approach, adding a strong understanding of communication strategy and content positioning to his work.