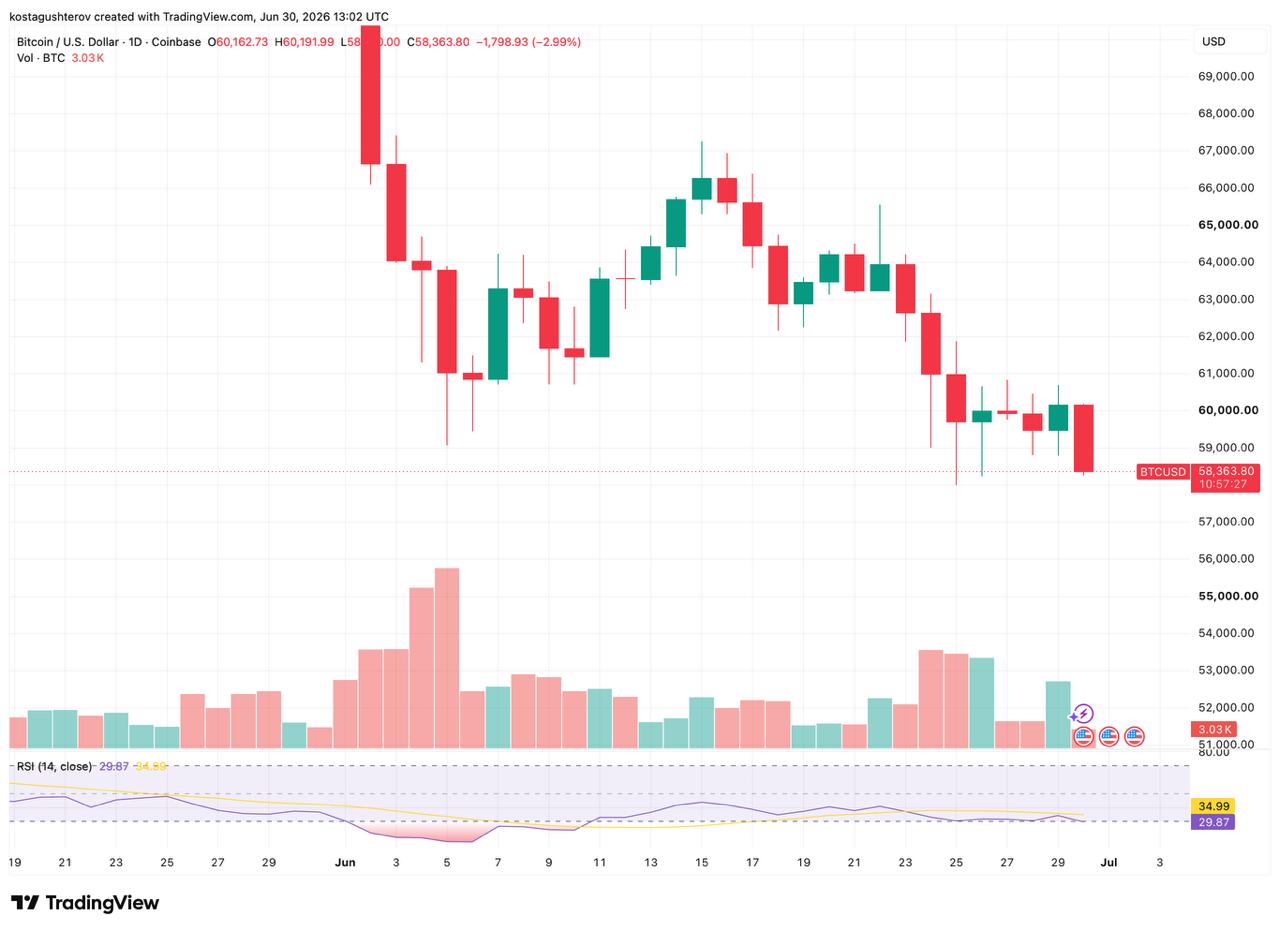
Bitcoin Falls to $58,300, Retesting Its 2026 Low

Bitcoin's price fell to $58,360 at the time of writing on June 30, down 2.99% on the day, dropping through a multi-day consolidation to retest the same zone that has marked the 2026 low since early June.
Key Takeaways
- BTC fell to $58,363 on June 30, down 2.99%, retesting its 2026 low.
- The $58,000s zone has now been tested again.
- RSI at 29.87 echoes the early-June test of the same floor.
- The retest follows heavy deleveraging, with open interest down 55% from its peak.
Price had been consolidating in the $59,500 to $60,500 range for several days, closing near $60,400 on June 29. Today’s candle erased that, falling straight through $59,000 to a low of $58,330 according to CoinMarketCap.
The Same Floor, Tested Twice
Today’s drop sits just above Bitcoin’s lowest point of 2026 so far. The prior floor was at the $58,000 level, set on 25th of June. So this is the same zone being retested twice. That repetition carries more weight than a single touch: a level tested twice is either building into a firmer support shelf or coming under repeated pressure that makes it likelier to give way on a third test. The data puts price at that decision point without resolving it.
The momentum reading reinforces the parallel. RSI sits at 29.87, with the signal line at 34.99. The previous test of $58,000 coincided with RSI in similarly stretched territory.
The Deleveraging Backdrop
The structural context sits in open interest, now $20.4 billion, down roughly 55% from the $45 billion peak around July 2025. That decline has tracked price lower from the all-time high near $126K. It matters how this floor is being tested: not with leverage building underneath it, which would raise the risk of a liquidation cascade, but after substantial deleveraging has already happened, which is structurally healthier.
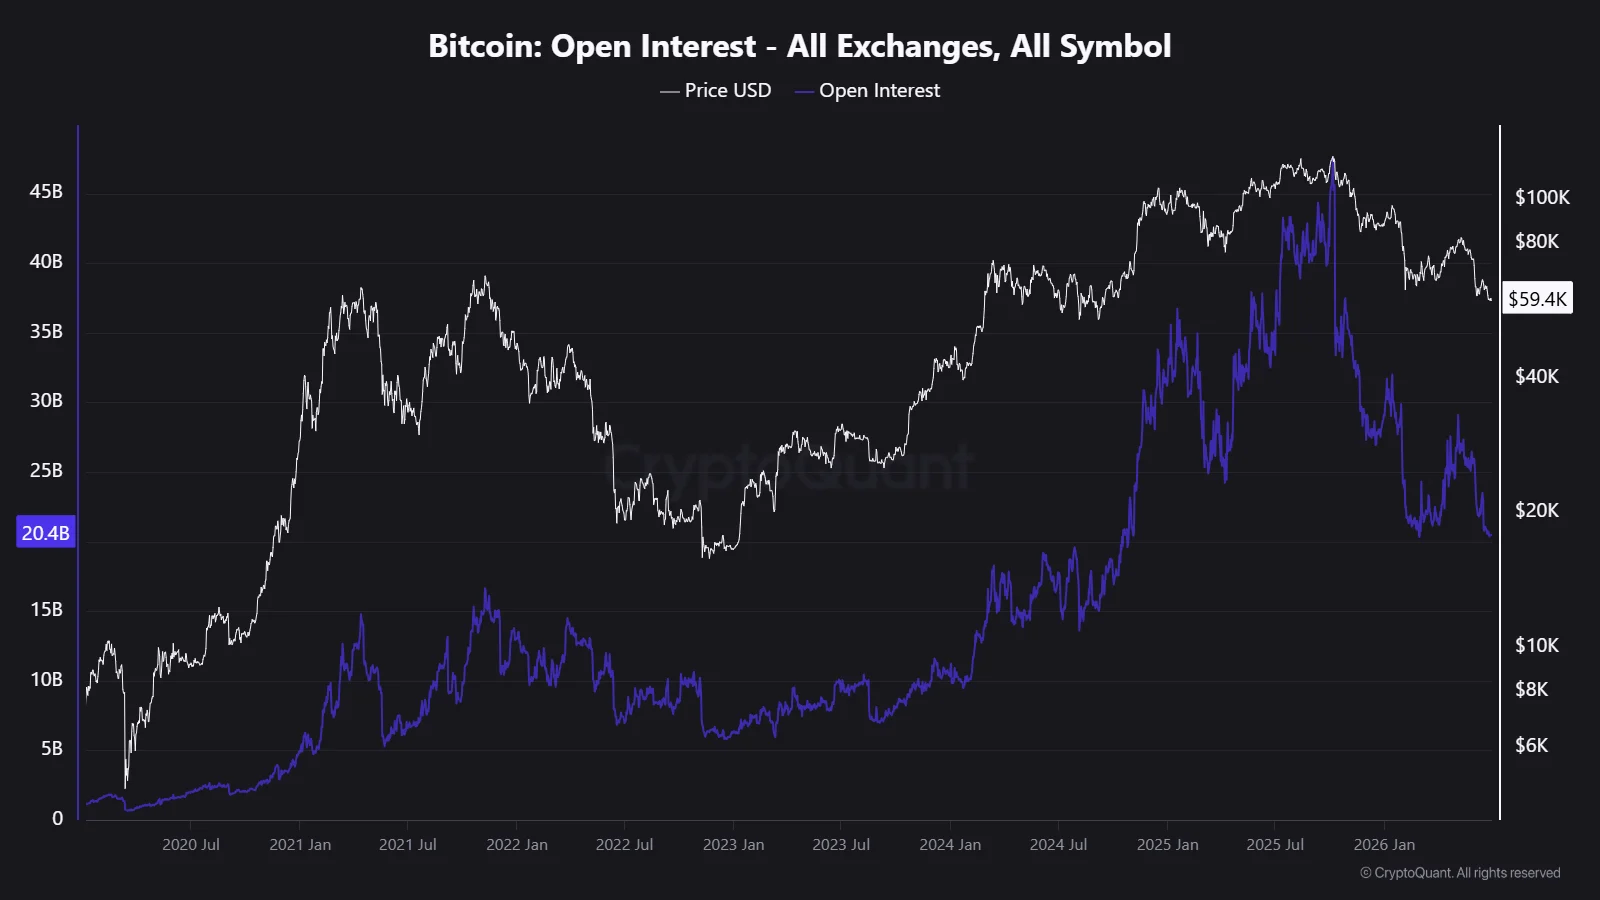
The caveat is in the same chart. Open interest bottomed near $5 to $6 billion at the 2022 cycle low, so today’s $20.4 billion, even after the 55% reduction, sits well above that trough. There’s precedent for OI compressing considerably further before a cycle-level bottom forms, so the deleveraging story doesn’t, by itself, confirm this floor holds.
The picture is clean. Bitcoin fell hard over the past few days, broke a short consolidation, and landed back at the $58,000s floor that has defined its 2026 low since early June. RSI confirms the technical similarity to that first test, and the retest is happening after real deleveraging rather than on stacked leverage, which is the healthier setup. But none of that resolves the binary: a level tested twice either holds and hardens into support, or breaks. With open interest still above its historical trough, the data describes proximity to that decision without saying which way it goes.
What’s worth watching from here is how price behaves at this level rather than the level alone. A daily close back above the $59,500 to $60,500 consolidation it just lost may suggest the floor is holding and buyers are defending it; a decisive close below the $58,330 low could mark a break of the zone that has capped the last time. Open interest is the second thing to track: if it keeps compressing toward its historical lows while price holds, that points to continued deleveraging rather than fresh leveraged selling. Until one of those resolves, the retest stays exactly that, a test, not an outcome.

Kosta has reported on cryptocurrency markets and blockchain infrastructure since 2020, bringing over six years of hands-on experience in the crypto industry built through daily tracking of markets, trends, and emerging blockchain developments. Specializing in Bitcoin on-chain analysis, institutional ETF flows, and digital asset price action, his work at Coindoo has been cited by other news agencies and consistently covers market developments with a focus on data-driven reporting across Bitcoin, Ethereum, Solana, and XRP. Over the years, Kosta has contributed to multiple crypto media outlets in different regions, authoring over 6,000 articles across the sector. His reporting spans cryptocurrency markets and the broader fintech industry, tracking not only price action but also the technological and regulatory forces shaping the ecosystem. To support his analysis, Kosta actively leverages on-chain data and metrics from leading platforms such as Santiment, Glassnode, and CryptoQuant, enabling deeper, evidence-based market insights. He believes in the power of transparency and the data that underpins the blockchain ecosystem. His academic background in Marketing Management from Denmark further complements his analytical approach, adding a strong understanding of communication strategy and content positioning to his work.