VanEck Sees Bitcoin Nearing Cycle Bottom as $62K Test Looms

VanEck believes Bitcoin is getting close to a cyclical bottom after a decline that has cut its price roughly in half. The daily chart is not confirming that view yet.
Key Takeaways
- VanEck sees Bitcoin nearing cycle exhaustion.
- BTC closed below two key supports.
- $62,250 is now the immediate test.
- A bottom has not been confirmed.
Why VanEck Thinks Bitcoin Is Nearing a Bottom
In an August 13 market outlook, VanEck described Bitcoin as approaching a cyclical bottom after falling from around $125,000 into the $58,000 range.
The firm bases that view on its GEO framework, which tracks Global Liquidity, Ecosystem Leverage and On-Chain Activity. Global liquidity and on-chain activity are currently neutral, while ecosystem leverage is constructive. VanEck describes the combination as showing signs of “near-bottoming” and says investors may consider beginning to scale back into exposure.
Its argument is about the maturity of the broader cycle rather than calling a specific price low. Bitcoin could still trade lower while leverage, liquidity and activity continue moving toward conditions normally associated with the later stages of a downturn.
The view also follows VanEck’s earlier cycle analysis. In June, Matthew Sigel pointed to Q4 as the preferred window for building full Bitcoin positions, arguing that the four-year cycle remained relevant despite growing institutional participation.
Bitcoin Has Lost Its Near-Term Support Cluster
The daily chart weakened just as VanEck’s broader indicators became more constructive.
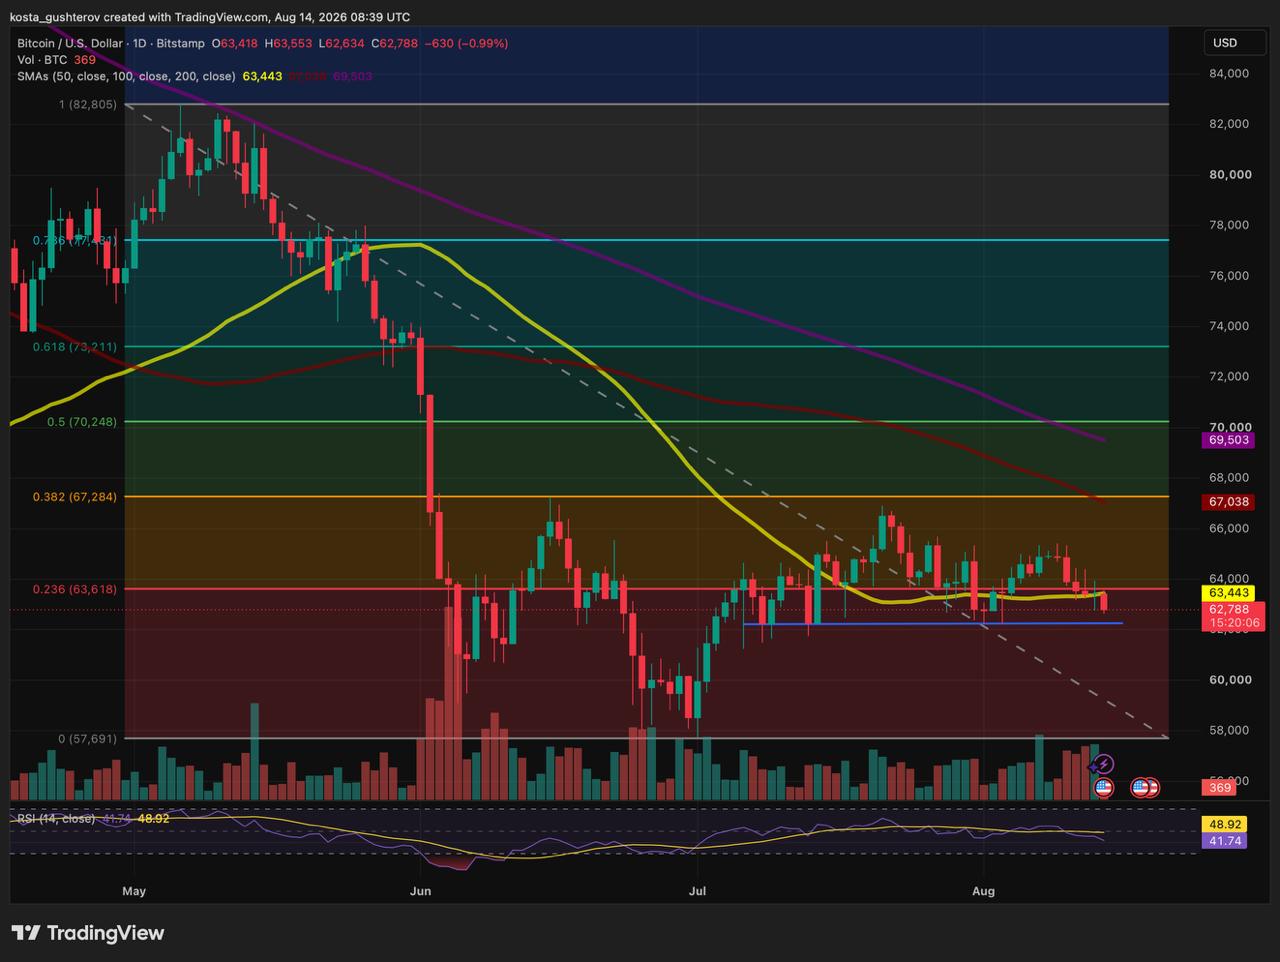
Bitcoin had been trading around a closely packed support area formed by the 50-day SMA close to $63,450 and the 0.236 Fibonacci retracement near $63,000. Wednesday’s close put BTC beneath both, and Thursday’s session has so far extended the move.
The break is still relatively narrow, particularly around the moving average, so a recovery above roughly $63,400-$63,600 would put Bitcoin back inside the structure that had supported the recent range.
Without that recovery, attention shifts lower.
$62,250 Is Now the Level to Watch
The nearest horizontal support sits around $62,250, an area that has contained several pullbacks during the recent consolidation.
Holding there would preserve the broader range despite the loss of the Fib and 50-day SMA. Buyers would still need to recover the broken support cluster above, but the July-August structure would remain intact.
A daily close below $62,250 would be more damaging. It would remove the horizontal floor that has supported the range and leave Bitcoin searching for demand deeper in the structure.
The larger June-July floor remains around $57,700-$57,900. That is not an immediate downside target, but it becomes more relevant if the support built above $62,000 fails.

A Cyclical Bottom Can Still Include More Downside
VanEck’s cycle indicators and Bitcoin’s daily chart are measuring different parts of the same process.
Liquidity, leverage and on-chain activity can begin stabilizing before price establishes its final low. Bitcoin can therefore be late in a cyclical decline without already having completed it.
The recent price structure supports that possibility without confirming it. Bitcoin formed lows around $57,800 in June and July before producing a higher low in August, suggesting that selling pressure has weakened compared with earlier in the correction.
Now the market has a more immediate test. The support around $62,250 needs to hold if that improving structure is to remain intact.
VanEck’s call may ultimately prove correct, but the daily chart suggests Bitcoin is still searching for the level where its cyclical bottom will be confirmed.
- Disclaimer: VanEck’s cyclical-bottom view is its own market assessment, not a guarantee that Bitcoin has reached its final low. Technical levels such as $62,250, the 50-day SMA and Fibonacci retracements may change as price develops and should not be treated as guaranteed support, targets or investment advice.



Alex is Editor-in-Chief of Coindoo and co-founder of Millennial Media Group, with nearly a decade of experience covering financial markets - crypto first, then everything else. It started in 2016 with Bitcoin. Like most people at the time, he didn't fully understand it - so he kept digging. Blockchain, tokenomics, the projects, the cycles. That curiosity never stopped, and eventually pulled him into traditional markets too: equities, commodities, macro. Not because he left crypto behind, but because you can't properly understand one without the other. What drives him is straightforward: he wants to know why something is happening, not just that it's happening. Most market coverage stops at the headline - price up, price down, here's a chart. Alex finds that kind of reporting actively unhelpful. If you walk away from an article without understanding the mechanism behind the move, what did you actually learn? He holds a degree in Tourism from New Bulgarian University - not the most obvious path into financial markets, but markets have a way of pulling in people who are simply too curious to stay out. He has authored over 200 in-depth analyses and more than 10,000 articles across crypto and traditional finance. He still thinks every day in markets teaches him something new. That's probably why he hasn't stopped.