Altcoins on Binance Are Underwater for the Longest Time Since 2022
The altcoin market is in one of its weakest stretches in years. Most coins have stayed stuck below a key long-term trend line for months, a slump matched only by the last bear market.
Key Takeaways
- 84% of Binance-listed altcoins trade below their 200-day moving average.
- That underperformance has lasted nearly eight months, the longest since 2022.
- The total crypto market has fallen about 52% from its cycle high.
- A narrow set of coins still posted huge gains, making selection everything.
According to CryptoQuant analyst Darkfost, 84% of altcoins trading on Binance currently sit below their 200-day moving average, and that condition has persisted for nearly eight months. That makes it the second-longest underperformance streak since 2020, behind only the last bear market, which ran roughly 10 months.
The figure (83.7% precisely) comes from a CryptoQuant chart tracking that share against Bitcoin’s price since 2021. The current reading sits deep in the chart’s worst-performance band, where 75% to 100% of altcoins are underwater on that measure.
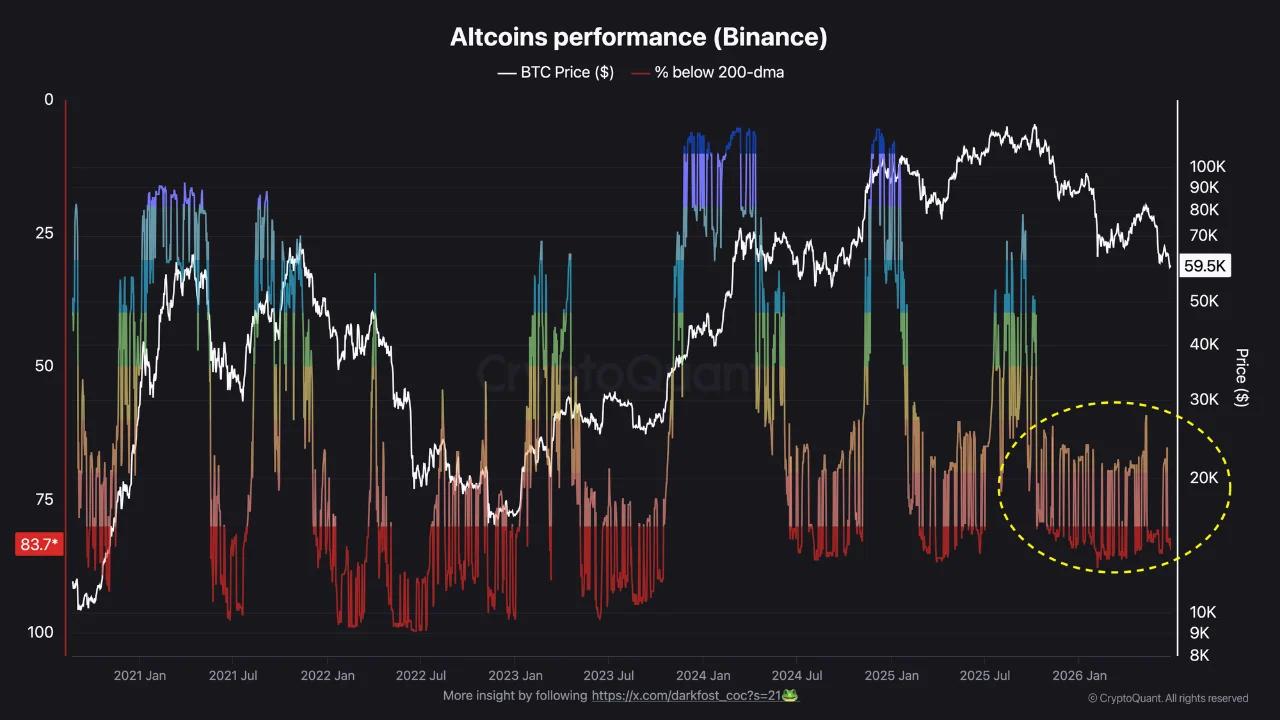
The structural detail that matters: over the current stretch, from late 2025 through June 2026, altcoins have oscillated inside that deep-red zone repeatedly without ever breaking out, while Bitcoin itself fell from around $100K toward $59,500. Each time Bitcoin found a local bounce, altcoin breadth failed to escape the underperformance band. Every momentum-recovery attempt has stalled.
The Whole Market Is Down by Half
The breadth damage sits inside a broad market correction. Total crypto market cap stands at $2.03 trillion, down 1.36% on the day, after a clean rejection from the cycle high near $4.25 trillion, according to TradingView, reached around the turn of 2026. That’s roughly a 52% drawdown from the top, a structurally significant correction rather than a shallow pullback.
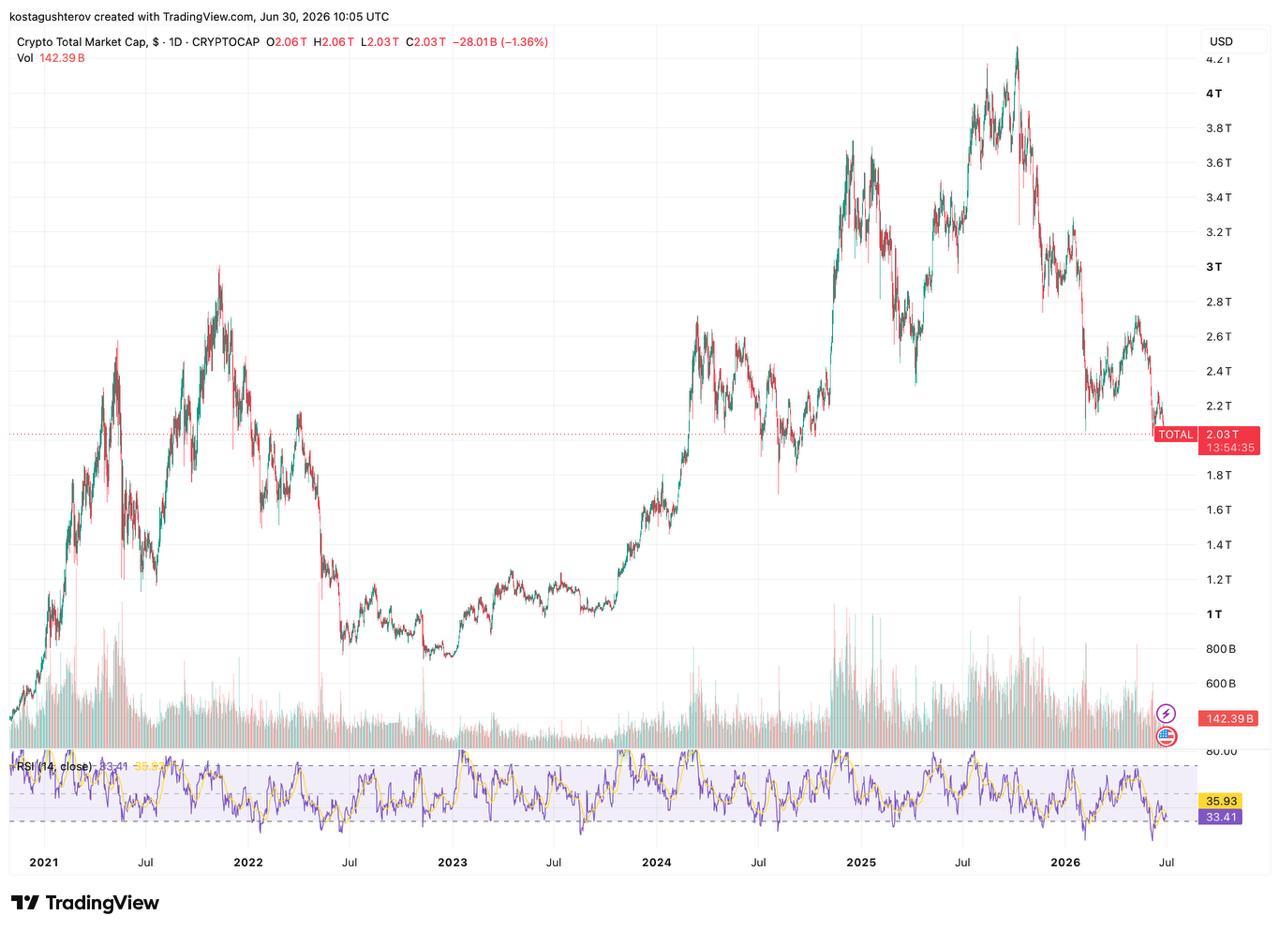
RSI on the total-market chart reads 33.41, with the signal line at 35.93, both below the neutral 50 mark but not yet at the most extreme oversold readings seen earlier in the cycle. Historically, RSI dipped to similar lows at the 2022 bottom and during the 2024 correction before both reversed, but the same chart also shows long stretches where low RSI persisted for months without an immediate turn, so it isn’t a timing signal on its own. The recent down-leg also carries visibly heavier selling volume than the quieter consolidation earlier in 2025, which says the decline had real conviction behind it.
How These Stretches Have Historically Behaved
The breadth indicator has a notable history worth understanding. It cycles in regime blocks rather than gradually: the deep-red stretches of 2021-2022 and 2022-2023 were eventually followed by strong best-performance readings that coincided with Bitcoin rallies in 2023, 2024, and 2025. The pattern confirms two things, that altcoins are tightly correlated with Bitcoin, and that these regimes tend to flip in sustained blocks rather than easing slowly. The current red stretch is the longest visible on the chart outside the 2022 bear market.
That history cuts both ways and is worth stating without spin: these stretches have ended before, and historically they’ve preceded medium-term recovery windows. But “they’ve ended before” says nothing about when, and the chart’s own record of months-long low-RSI periods is the reminder that the turn doesn’t arrive on schedule.
Even the Large Caps Aren’t Spared
This isn’t just a micro-cap problem. The weakest 90-day performers include established, large-cap names alongside smaller tokens:
| Asset | 90-Day Change |
|---|---|
| BCH | -56.10% |
| ADA | -41.61% |
| WLFI | -41.04% |
| DOT | -36.64% |
| APT | -36.62% |
| VET | -35.96% |
| PEPE | -31.94% |
| SHIB | -28.97% |
Names like Bitcoin Cash, Cardano, Polkadot, and Aptos being down 35% to 56% over 90 days is exactly what an 84%-below-200-DMA reading implies. The weakness is broad, not confined to the speculative fringe.
A Few Coins Soared Anyway
Here is the nuance that keeps the picture honest. Even in this depressed tape, a small subset of coins posted extreme 90-day gains:
| Asset | 90-Day Change |
|---|---|
| VELVET | +2072.62% |
| HYPE | +76.52% |
| INJ | +58.29% |
| ZEC | +58.16% |
| NEAR | +52.23% |
| WLD | +49.63% |
| ONDO | +13.70% |
| TRX | +0.87% |
The dispersion is the story. The gap between the top gainer at over 2,000% and the broad 84% underperformance basket is enormous, and the winners cluster in specific themes, DeFi tooling, AI-adjacent names, and individual narrative plays, rather than spreading evenly. This is what makes it a stock-picker’s market within crypto: gains exist, but they’re concentrated in a narrow minority, and broad altcoin exposure would have caught the 84%, not the outliers.
The Honest Read
The data establishes a clear picture without needing spin. Structurally, the trend is bearish: the total market is down roughly 52% from its high, altcoin breadth has been damaged for nearly eight months, and even large-cap legacy names are deep in the red. That’s the dominant condition, and it’s real.
The counterweight is equally factual. These deep-underperformance regimes have historically ended in sustained blocks that preceded medium-term opportunity windows, and even now a narrow set of assets has delivered outsized returns. Both things are true at once: the broad altcoin market is in a confirmed downtrend, while selection has mattered far more than it did in easier cycles. What the data does not do is tell you when the regime flips. History says these stretches don’t last forever; it doesn’t say they end tomorrow. The signal worth watching is the breadth indicator itself, a sustained move out of the red band, not another failed bounce, is what has historically marked the change.

Alex is Editor-in-Chief of Coindoo and co-founder of Millennial Media Group, with nearly a decade of experience covering financial markets - crypto first, then everything else. It started in 2016 with Bitcoin. Like most people at the time, he didn't fully understand it - so he kept digging. Blockchain, tokenomics, the projects, the cycles. That curiosity never stopped, and eventually pulled him into traditional markets too: equities, commodities, macro. Not because he left crypto behind, but because you can't properly understand one without the other. What drives him is straightforward: he wants to know why something is happening, not just that it's happening. Most market coverage stops at the headline - price up, price down, here's a chart. Alex finds that kind of reporting actively unhelpful. If you walk away from an article without understanding the mechanism behind the move, what did you actually learn? He holds a degree in Tourism from New Bulgarian University - not the most obvious path into financial markets, but markets have a way of pulling in people who are simply too curious to stay out. He has authored over 200 in-depth analyses and more than 10,000 articles across crypto and traditional finance. He still thinks every day in markets teaches him something new. That's probably why he hasn't stopped.