XRP Drops to Its Lowest Level Since April: Three Sources Tell Different Stories

XRP is trading at $1.32 at the time of writing, having broken below the Fibonacci 0.786 level at $1.3335 and entered the grey retracement zone between 0.786 and the full retracement at $1.2779.
- XRP trading at $1.3225, in the grey zone between Fibonacci 0.786 and full retracement
- Fibonacci levels broken sequentially: 0.236, 0.382, 0.5, 0.618, now 0.786
- Next labeled support: Fibonacci 1.0 at $1.2779, $0.045 below current price
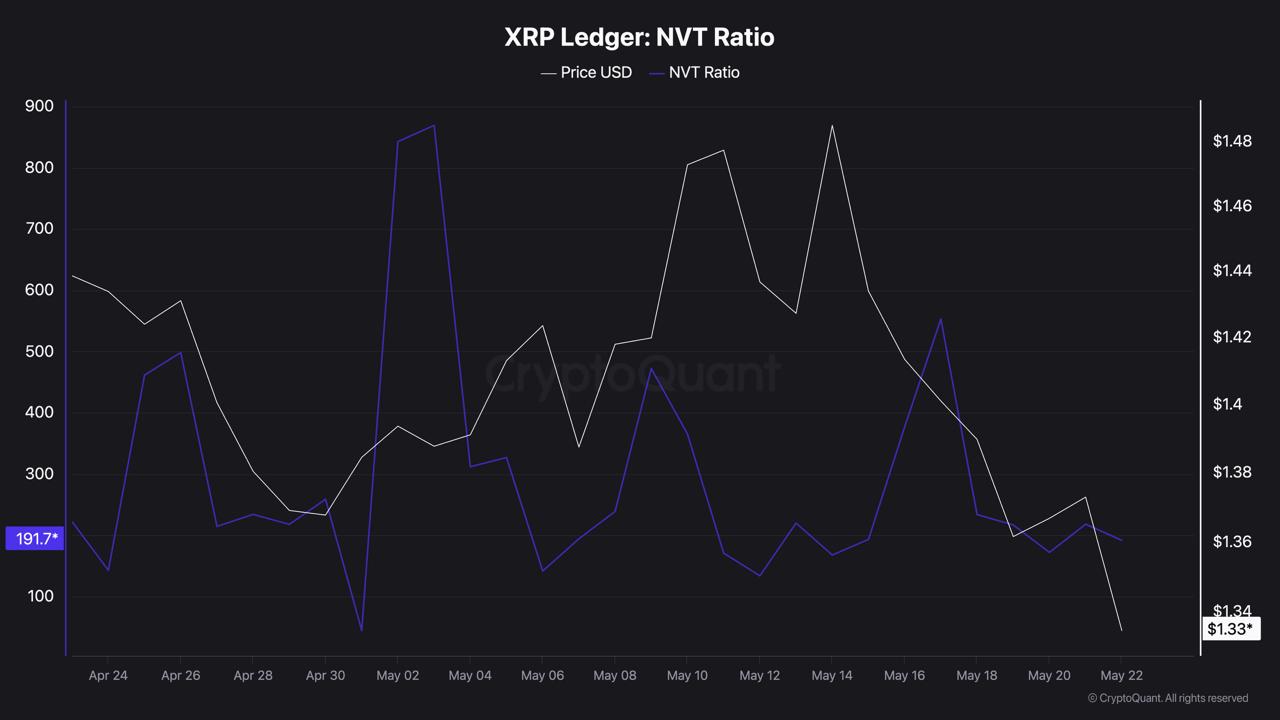
- NVT Ratio at 191.7, down 12.1% in 24 hours: overvaluation correcting alongside price
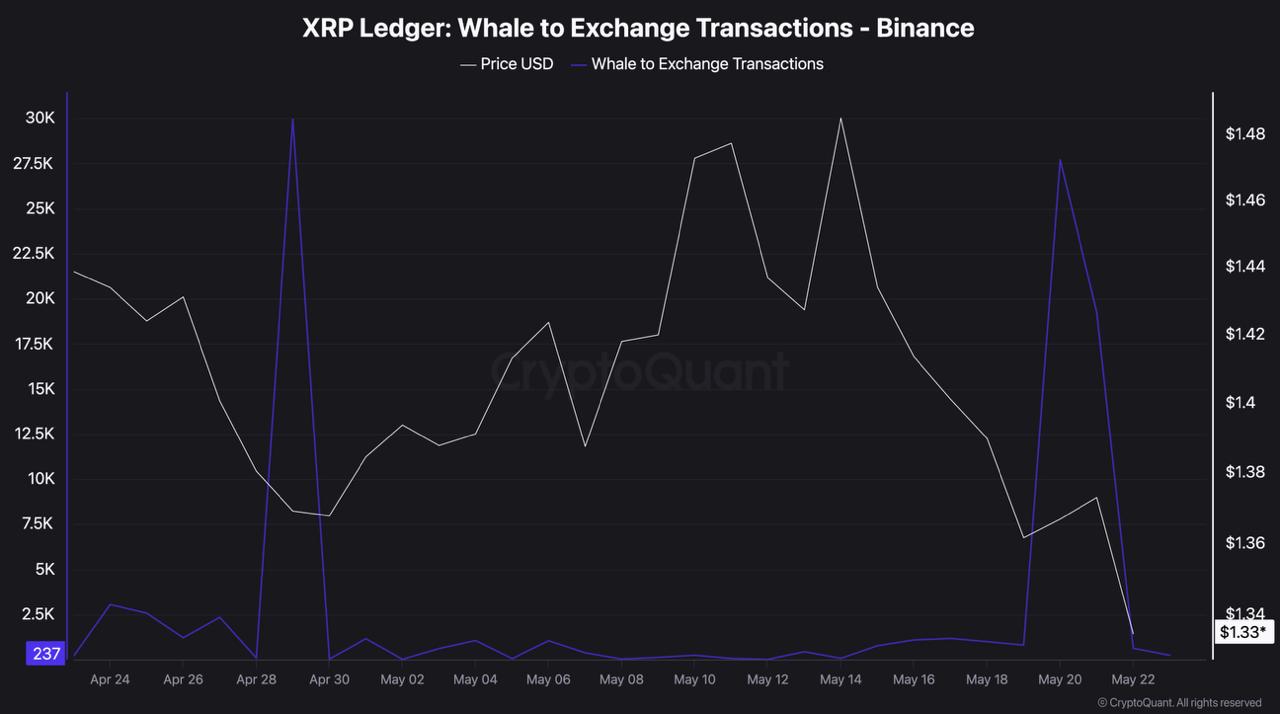
- Whale to exchange transactions at 237: near chart floor, distribution pressure absent
The chart shows where price is within the Fibonacci grid. The on-chain data shows what large holders are doing inside it. The monthly formation analysis shows where this compression has historically led.
The Fibonacci Grid: A Sequential Breakdown
The rally from $1.2779 to $1.5490 that defined XRP’s April-May recovery is now being retraced level by level. The Fibonacci grid on the chart makes the sequence visible. Price moved through the pink zone above $1.4850 during the May highs, then lost the 0.236 at $1.4850. It spent time in the orange zone between $1.4454 and $1.4850 before losing the 0.382. It failed to hold the green zone around $1.4194, losing the 0.5 level. The teal zone between $1.3884 and $1.4194 gave way next, with price losing the 0.618. The light blue zone between $1.3335 and $1.3884 then became the battleground through May before today’s break through the 0.786.
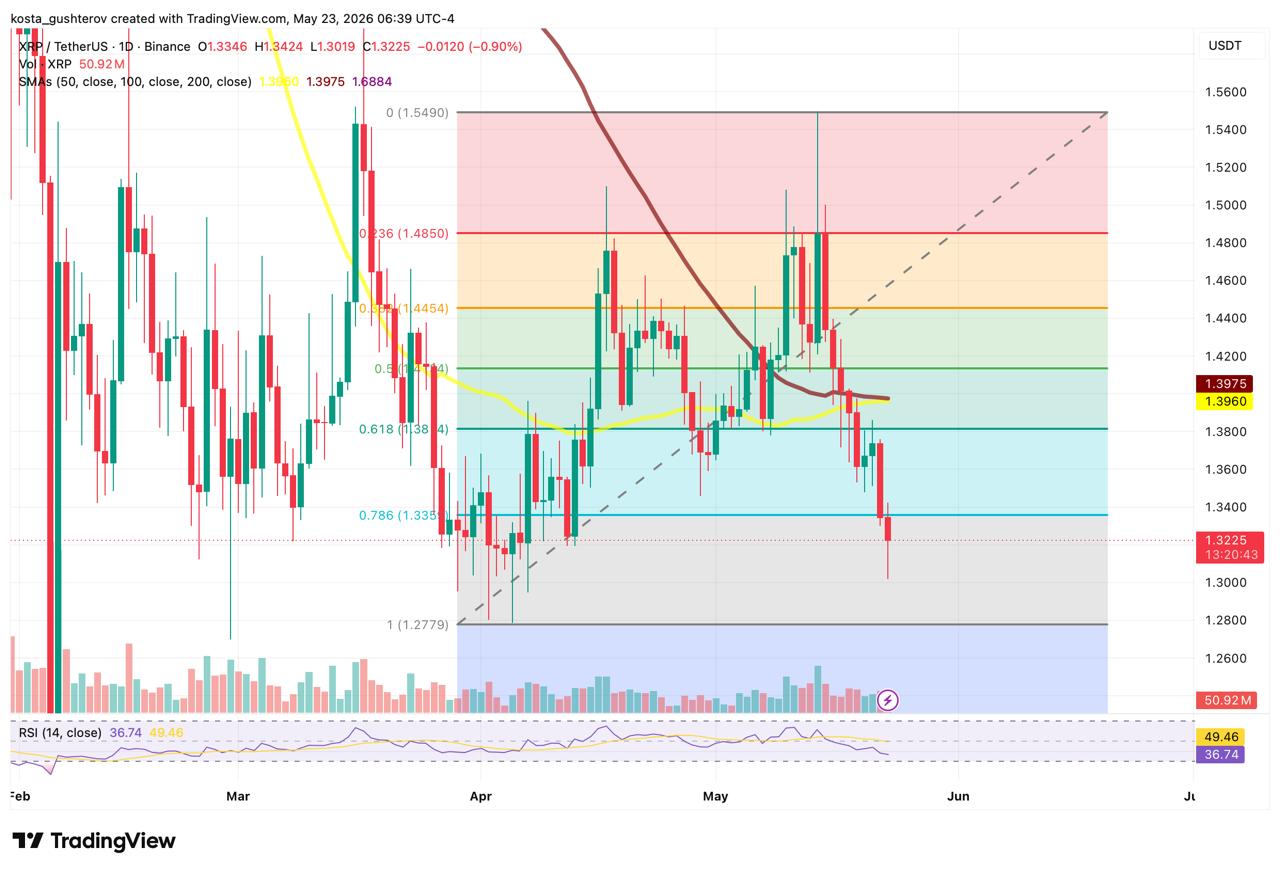
Breaking below the Fibonacci 0.786 at $1.3335 means XRP has retraced more than 78.6% of the entire move from $1.2779 to $1.5490, and the chart between the current price of $1.3225 and the full retracement level at $1.2779 contains no labeled intermediate support. Current price is $0.0446 above that floor. The grey zone the price now occupies is the last structured zone before a full give-back of the entire rally.
Analytically, the ascending dashed trendline from the late March lows and the 0.786 Fibonacci level broke in the same session, removing two separate structural references simultaneously, though the chart alone does not confirm whether that simultaneity is causal or coincidental. The SMA50 at $1.3960 and SMA100 at $1.3975 sit $0.074 above current price, having converged to within $0.0015 of each other, forming a unified declining resistance ceiling. The RSI at 36.74 with signal at 49.46 confirms negative momentum with a 12.72-point spread, approaching oversold territory without having entered it.
What Three On-Chain Sources Show at This Level
The on-chain picture is analytically unusual: price is at its weakest structural point on the Fibonacci grid while distribution signals are at their lowest reading in the visible range.
Whale to exchange transactions at 237 near the chart’s floor while price breaks to new lows describes a market where large holders are not moving coins to exchanges at scale, which reduces the immediate distribution pressure but does not explain why price continues declining without that pressure.
The CryptoQuant chart shows Binance whale to exchange transactions collapsed from approximately 27,500 on May 20 to the current 237, a spike that coincided with the price break below $1.40 and has since returned to near-zero.
Ali Charts confirms the pattern from a different angle: large XRP transactions over $1 million dropped 57.3% in 9 days, from 157 to 67. Ali Charts reads this as a compression phase where whales have stepped back to let the price range settle, reducing immediate volatility and allowing order books to mature.
In the last 9 days, whale activity on the $XRP network has dropped from 157 large transactions worth over $1 million to just 67 today, representing a 57.3% decline.
When large-scale transaction volume thins out like this, it tells me the market could be entering a compression… pic.twitter.com/lVQGjhqVzG
— Ali Charts (@alicharts) May 23, 2026
The NVT Ratio declining 12.1% in 24 hours to 191.7 while price falls is analytically distinct from a rising NVT in a declining market: it suggests the valuation compression is outpacing any deterioration in on-chain activity, meaning the overvaluation signal that fragmented previous rallies is now correcting alongside the price rather than preceding further decline. Analytically, the direction of this correction is favorable in the sense that the gap between market cap and network activity is narrowing, though price is doing the narrowing rather than network activity expanding. The NVT chart shows the ratio declining from peaks above 800 in early May to the current 191.7.
All three sources, across three different timeframes, describe large holders not distributing, on-chain overvaluation correcting, and price compressing into the final retracement zone.
What the Monthly Formation Implies
EGRAG identifies a Descending Broadening Wedge on XRP’s monthly chart, a formation that in EGRAG’s historical reading produces final capitulation followed by violent expansion. The current short-term read is bearish compression. The macro read remains bullish unless the structure fully breaks. EGRAG’s probable sequence: more chop, emotional exhaustion, one final volatility event, then a massive directional move.
#XRP – Formation Talks:
The current structure looks like a Descending Broadening Wedge. This is NOT a random formation.
Historically, these structures often produce:
▫️Final capitulation
THEN
▫️Violent expansion 🚀Key Levels:
🔴 $1.11 = Critical Support
🟢 $3.00 = Bullish… pic.twitter.com/A2EmjMarj0— EGRAG CRYPTO (@egragcrypto) May 23, 2026
The key levels EGRAG identifies anchor the range. Critical support sits at $1.11, approximately 16% below current price. Bullish confirmation requires a weekly or monthly reclaim above $2.65-$3.00. Expansion targets are $7-$11. The extreme flush scenario is $0.32. EGRAG notes that XRP rarely moves gradually: it compresses for months and then explodes vertically. The current compression described by the Fibonacci grid, the declining on-chain activity, and the NVT correction is consistent with that behavioral pattern.
The chart’s next labeled reference is the full Fibonacci retracement at $1.2779. A daily close above $1.3335 reclaiming the 0.786 level would indicate the current break was a liquidity sweep into the grey zone rather than a structural breakdown. A daily close below $1.2779 on expanding volume would confirm the full retracement and bring $1.11 into play as the critical support EGRAG identifies as the structure’s floor before any expansion becomes possible. What happens at $1.2779 is the question the chart, the on-chain data, and the monthly formation are all waiting to answer.
The information provided in this article is for educational purposes only and does not constitute financial, investment, or trading advice. Coindoo.com does not endorse or recommend any specific investment strategy or cryptocurrency. Always conduct your own research and consult with a licensed financial advisor before making any investment decisions.

Kosta has reported on cryptocurrency markets and blockchain infrastructure since 2020, bringing over six years of hands-on experience in the crypto industry built through daily tracking of markets, trends, and emerging blockchain developments. Specializing in Bitcoin on-chain analysis, institutional ETF flows, and digital asset price action, his work at Coindoo has been cited by other news agencies and consistently covers market developments with a focus on data-driven reporting across Bitcoin, Ethereum, Solana, and XRP. Over the years, Kosta has contributed to multiple crypto media outlets in different regions, authoring over 6,000 articles across the sector. His reporting spans cryptocurrency markets and the broader fintech industry, tracking not only price action but also the technological and regulatory forces shaping the ecosystem. To support his analysis, Kosta actively leverages on-chain data and metrics from leading platforms such as Santiment, Glassnode, and CryptoQuant, enabling deeper, evidence-based market insights. He believes in the power of transparency and the data that underpins the blockchain ecosystem. His academic background in Marketing Management from Denmark further complements his analytical approach, adding a strong understanding of communication strategy and content positioning to his work.