Why Bitcoin’s Order Book Can Fool You
On April 27, Binance's Bitcoin perpetual book showed deep liquidity and a one-tick spread while its price levels changed about two million times in ten minutes.
The short version
- Depth shows quantity, not how fast it changes.
- Book Churn counts price-level updates every ten minutes.
- Volatility hit rate: 63% against a 50% baseline.
- A simple price-range signal matched it.
Glassnode’s November 18 research built the metric from Binance perpetual futures data, with Bitcoin and Ether backfilled to January 2020. The results hold up against random noise. They barely beat a far simpler measure.
What Book Churn actually counts
Binance streams every change to its order book as it happens. Each message says, in effect, that a given price now holds a new quantity of bids or asks. Trades trigger messages too, because a fill shrinks what rests at that price. Glassnode adds these messages up in ten-minute windows. On BTCUSDT, a typical window carries about 607,000.
A raw count needs context. Glassnode turns it into a score by measuring each window against the same clock hour over the previous 30 days, so a busy trading hour faces its own history and the dead of night faces its own. A score of 2 marks an unusually active window. Readings of 3 or more are rarer still.
The feed has blind spots. It reports price levels, not individual orders, so one message can bundle several cancels, new orders and fills. It doesn’t separate a pulled quote from an executed one, and it names no traders. When the exchange connection drops and resets, a window can even read quieter than it was. A spike tells you the book got busy. It can’t tell you why.
Two books, one screenshot
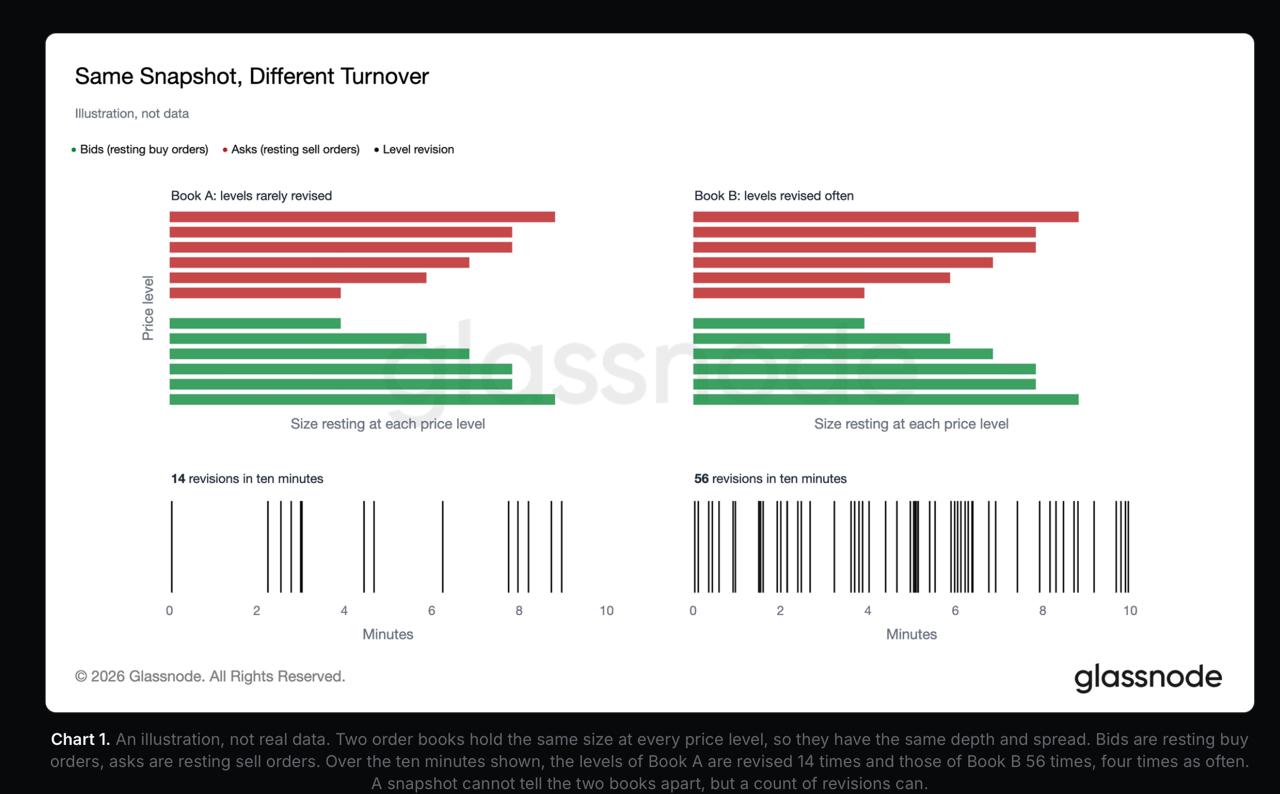
Picture two order books with identical quantities at every price. Same depth. Same spread. A screenshot can’t tell them apart, but ten minutes of watching can: in Glassnode’s illustration, one book changes 14 times and the other 56. Those counts are invented to show the idea. The point behind them is real. Depth tells you how much is resting, churn tells you how often it moves, and neither metric answers the other’s question.
April 27: the book barely flinched, the feed tripled
Depth here means the dollar value of bids and asks resting within 1% of the mid-price. The spread is the gap between the best bid and the best ask. On the morning of April 27, both looked calm.
Three windows starting at 05:10, 05:20 and 05:30 UTC carried 1.8 million to 2.1 million updates each, up from 0.6 million to 0.9 million in the hour before. Churn scores hit 4.34, 3.83 and 3.41. Combined depth, which had ranged between $400 million and $464 million in the prior hour, slipped to between $377 million and $412 million. Then it jumped to $565 million in the next window. The spread sat at about one tick throughout.
Price didn’t sit still. The high-to-low range reached 95 basis points, close to 1%, in the first burst window, then 28 and 39 basis points in the next two. Range shows how far price traveled inside a window, not which way it finished.
So a trader watching depth and spread saw a mild dip. Underneath, the update feed nearly tripled.
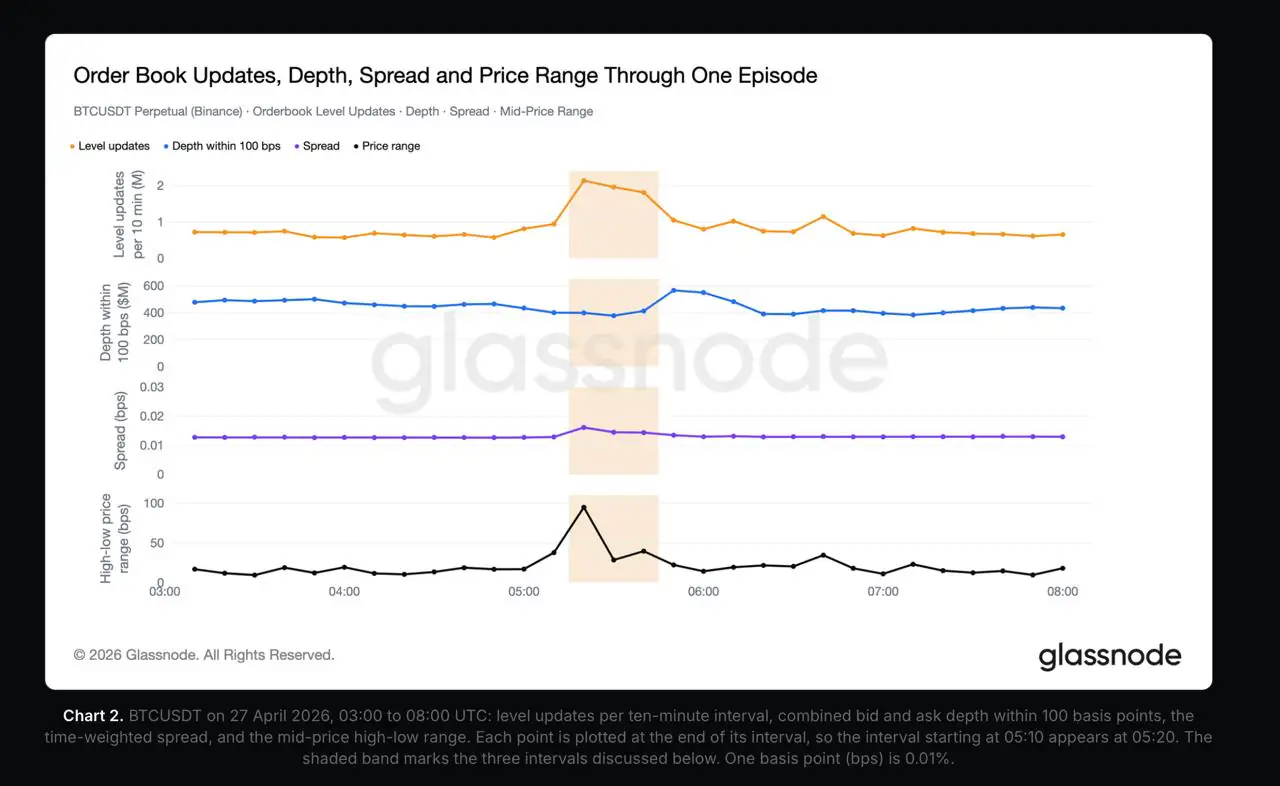
Most busy windows don’t look like this. Across BTCUSDT history, higher churn usually came with thinner depth and wider spreads, with correlations of -0.40 and +0.49 respectively. The case that matters most, with normal depth, quiet prices and frantic quoting all at once, showed up in only about 7% of BTCUSDT readings at 3 or above. Those are the windows where churn picks up something nothing else on the screen shows.
Keep the scope in mind. This is one perpetual futures contract on one exchange, not the whole Bitcoin market. And combined depth counts both sides of the book, so a buyer can only draw on the asks, a fraction of that total.
Where churn meets your fill
A market buy takes the cheapest ask first, then the next one up, and keeps climbing until the order is complete. Coinbase’s trading rules spell out that a single market order can fill at several prices. Here’s a made-up book, shown twice: once as you saw it, and once after a single quote moved.
| Ask price | Book A: as seen | Book B: one quote moved |
|---|---|---|
| $100,000 | 1 BTC | none |
| $100,100 | 1 BTC | 1 BTC |
| $100,150 | none | 1 BTC |
| $100,200 | 3 BTC | 3 BTC |
| Cost of 3 BTC | $300,300 | $300,450 |
In Book A, a 3 BTC market buy pays $100,000, $100,100 and $100,200, an average of $100,100 before fees. Anyone expecting the whole order at the top price pays $300 more than planned. Thin depth at the best ask did that. Churn played no part.
Book B is where churn comes in. The seller at $100,000 pulls that coin and reposts it at $100,150 a moment before your order lands. You see the same screen and send the same order, and you pay $450 above the top-of-book estimate. Repeat that kind of swap across thousands of price levels and you get a churn spike. The score can’t say which level will move, or where it goes next.
A limit order caps the price but may leave you partly filled, or not filled at all. Coindoo’s guide to how crypto orders execute covers that trade-off, and fees sit on top of every figure above, as our breakdown of Bitcoin buying costs shows.
63% sounds strong. The baseline is 50%.
Glassnode’s main test asked a narrow question. When churn scored 2 or higher, was the next hour more volatile than the median hour? Half of all hours land above the median by definition, so a coin flip scores 50%.
| Signal | BTCUSDT | ETHUSDT |
|---|---|---|
| Random placebo spikes | 51.2% | 50.5% |
| Churn reading from 24 hours earlier | 58.9% | 58.4% |
| Churn score 2 or higher | 63.2% | 63.4% |
| Price-range signal | 63.7% | 63.5% |
| Churn score 3 or higher | 69.1% | 68.2% |
Start at the top. Random spikes land right on the coin flip, which tells you the test isn’t rigged. Churn clears that line, and higher scores clear it by more.
The highlighted row is the awkward one. Glassnode built a matching signal from nothing but each window’s high-to-low swing, and it edged churn by a fraction of a point, a gap too small to call either way. The two scores move together with a correlation of 0.84. Price range alone explains about 70% of the variation in the churn score. For the most part, churn re-measures price movement through the quote feed.
Not entirely, though. In roughly half the windows where churn fired, the range signal stayed silent. Similar accuracy, different moments.
The day-old row tells its own story. A reading from a full day earlier kept most of the edge, which points to volatility that lingers for days, while the current reading adds four to five points on top. And about 37% of high readings still came before a perfectly ordinary hour.
Glassnode lists its own limits. The test ran in-sample: volatility buckets and control groups were set using each full calendar year, including months a live trader wouldn’t have seen yet. Results for 2020 and 2021 came in at 53% to 57%, not clearly above chance. By Glassnode’s own description, Bitcoin and Ether on one exchange amount to close to a single test. The score says nothing about direction, and the study never measured trading returns or execution costs.
Before you send a large order
Check the ask side at your own order size. A combined depth figure blends buyers and sellers, and the best price usually covers only the first slice of a big order.
During a churn spike, read a one-tick spread as a fact about the best price and nothing deeper. The next level up may be the one getting rewritten.
Then decide which risk you would rather carry. A market order gets the trade done at an unknown price. A limit order holds the price and may never fill.
Glassnode hasn’t tested whether churn improves real fills once depth, spread and fees enter the math. It also doesn’t publish how long each reading takes to arrive after its window closes, which matters to anyone hoping to act on one. What the metric does today is narrower and still worth having. When updates triple and the spread doesn’t budge, the calm you see is only the top layer.



Alexander Zdravkov is a market analyst and crypto journalist with interests in economics, broader financial markets and digital assets. His journey into crypto began more than four years ago, driven by a fascination with the rapid evolution of blockchain technology and the transformative potential of decentralized finance. He began analyzing market cycles and identifying emerging trends before they reach the mainstream. He holds a degree in International Relations - a background that helped shape his broader perspective on global economics, geopolitics, and the interconnected nature of modern financial markets. Whether covering the latest developments in the crypto sector or exploring broader macroeconomic themes, Alexander focuses on giving readers context rather than simply repeating headlines. During his career, he has authored more than 5,000 articles covering cryptocurrencies, traditional finance, and global market developments. His work spans everything from Bitcoin and altcoins to macroeconomic trends influencing risk assets worldwide.