Bitcoin Price Reclaims $66K After Sinking to $62K

Bitcoin fell to $62,006 on Sunday before buyers lifted it back to $66,000, leaving the daily close against the 0.786 Fibonacci level as the question of the session.
Key Takeaways
- Sunday low $62,006, price back at $66,000
- Daily close near $64,069 is the line
- RSI 26.56, still oversold, below signal
- Overhead: $68,314–$69,062 zone caps relief
Coindoo’s previous update followed the drop under $66,000 as the golden pocket gave way; the two sessions since have pushed the price lower and then sharply back.
Two Candles, Two Different Sessions
Saturday’s candle on the Binance daily chart did the damage. BTC/USDT opened at $68,314, managed a high of only $68,446, and sold off through the $66,000 area without a bounce to close at $64,150. That close landed $81 above the 0.786 Fibonacci retracement near $64,069, and it came on the largest red volume bar of the November decline.
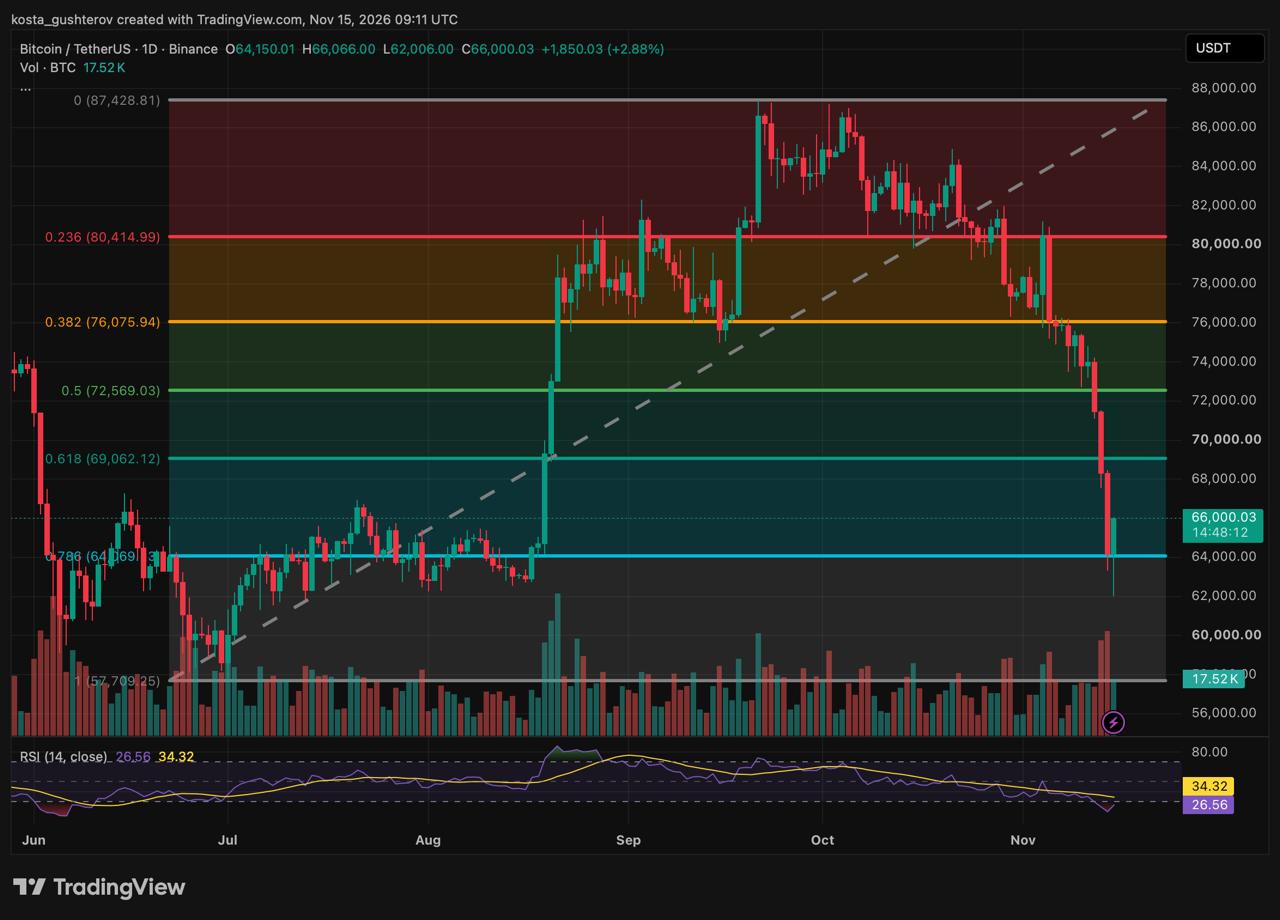
Sunday’s candle opened at the same $64,150 and went straight through the level. The low printed at $62,006, inside the lower half of the range Bitcoin traded through July and August, before buying absorbed the move. Price has since climbed to a session high of $66,066 and is trading near $66,000 at the time of writing with about 14 hours and 48 minutes left in the day, up $1,850 or 2.88%. The lower wick measures roughly $2,144 from the open, and the recovery so far has clawed back a little under half of Saturday’s body.
Oversold, But Not Yet Turning
The daily RSI (14, close) has hooked up from Saturday’s extreme to 26.56. That is still below 30, and still below its own signal line at 34.32, so the indicator has stopped falling without yet confirming a shift in momentum. The last time the daily RSI sat this low was the June wick, after which it climbed out of oversold territory over the following sessions; the setup now rhymes with that one, but a reading of 26.56 is a description of how stretched the sell-off became, not a signal on its own.
Volume tells a similar half-story. Sunday has traded 17.52K BTC with most of the session still to run, against Saturday’s spike, which was the heaviest selling day of the breakdown. Whether today’s bar ends up comparable in size, and whether it closes green, is part of what the next 15 hours decide.
Everything Comes Down to the Close
The shelf between the 0.786 retracement near $64,069 and the $64,150 open-and-close level is the reference for both directions. A daily close above it keeps Sunday’s dip classified as a failed break below support; a close back under it turns the long lower wick into the first half of a two-step move lower. The scenarios below start from that split.
If the shelf holds
With $64,069 defended on a closing basis, the first hurdle is today’s own high at $66,066. Clearing it puts Saturday’s breakdown candle in play, with its open and high at $68,314 to $68,446 as the natural fill target. Just above that sits the broken 0.618 golden pocket around $69,062, now the main overhead resistance. Only a daily close back above $69,062 brings the 0.5 retracement close to $72,569 into the conversation; a touch and rejection at the zone would not.
If the bounce fades
The broader daily structure is still a sequence of lower highs and lower lows from the $87,429 top, and a single oversold bounce inside that sequence has no claim to being the bottom. A rejection anywhere in the $68,314 to $69,062 band, or a reversal before tonight’s close that drags price back below $64,069, points the market at a fill of Sunday’s wick toward $62,006. That low is the short-term floor; a daily close below $64,069 followed by a break of $62,006 would invalidate the rebound entirely and leave the round $60,000 figure and the 1.0 swing origin close to $57,709 as the next references on the chart.
Zooming out
Even the relief scenario leaves Bitcoin below the 0.5 level around $72,569 and well below the 0.382 near $76,076 and the 0.236 near $80,415, which is where the October lower highs were formed. The retracement grid from $57,709 to $87,429 remains intact as the frame for the whole decline, and nothing in Sunday’s candle changes the trend on that scale; what it changes is whether the next move inside the frame starts from $64,000 or from $62,000.
For now the chart shows a market that broke a level it had held for a day, found buyers within hours, and is trading back above it with the close still open. The number to check at 00:00 UTC is simple: above $64,069, Sunday was a flush that failed; below it, the flush is not finished.



Alex is Editor-in-Chief of Coindoo and co-founder of Millennial Media Group, with nearly a decade of experience covering financial markets - crypto first, then everything else. It started in 2016 with Bitcoin. Like most people at the time, he didn't fully understand it - so he kept digging. Blockchain, tokenomics, the projects, the cycles. That curiosity never stopped, and eventually pulled him into traditional markets too: equities, commodities, macro. Not because he left crypto behind, but because you can't properly understand one without the other. What drives him is straightforward: he wants to know why something is happening, not just that it's happening. Most market coverage stops at the headline - price up, price down, here's a chart. Alex finds that kind of reporting actively unhelpful. If you walk away from an article without understanding the mechanism behind the move, what did you actually learn? He holds a degree in Tourism from New Bulgarian University - not the most obvious path into financial markets, but markets have a way of pulling in people who are simply too curious to stay out. He has authored over 200 in-depth analyses and more than 10,000 articles across crypto and traditional finance. He still thinks every day in markets teaches him something new. That's probably why he hasn't stopped.