Bitcoin at Critical Support: How PPI Might Affect the Price

Bitcoin enters Thursday's US producer inflation report at an awkward point on the daily chart, sitting just above its strongest nearby support while a heavy resistance cluster waits roughly $3,500 higher.
Key Takeaways
- Bitcoin is holding key daily support.
- $67,200 remains the main resistance zone.
- PPI might decide which level breaks first.
The macro backdrop shifted yesterday after US CPI eased to 3.4% in July from 3.5% in June. Core inflation slipped to 2.5%, while monthly headline and core prices rose 0.1% and 0.2%, respectively.
Attention now turns to producer prices, where the inflation picture looks less settled.
PPI Is the Next Test After Softer CPI
The Bureau of Labor Statistics will release July PPI at 8:30 a.m. ET. Consensus points to a 0.2% monthly rise in headline prices after June’s 0.3% decline, with core PPI seen increasing 0.3%. On an annual basis, headline inflation is forecast to ease to around 4.9% from 5.5%.
The softer CPI reading took some pressure off the case for another near-term Fed hike, but several large institutions still see risks building further up the price chain.
Goldman Sachs Asset Management expects tariffs and energy costs to keep feeding through to inflation, with core inflation moving back toward 3% by December. The firm sees the Fed waiting to assess how much of those higher business costs eventually reaches consumers.
RBC Economics takes a more cautious view, arguing that tariffs and energy are already lifting input costs and that some of that pressure is likely to reach consumers. RBC believes this might be enough to keep the Fed from cutting rates this year.
Survey data offers some support for that concern. S&P Global’s July US PMI showed input-cost inflation at its highest since May 2025 and selling-price inflation at its strongest since July 2022, with companies citing energy, shipping, tariffs and supplier costs.
Deutsche Bank’s Jim Reid sees less urgency, pointing to encouraging core inflation readings and weaker employment data. Bank of America’s Stephen Juneau remains more hawkish and still sees room for additional tightening, although the latest inflation data might reduce how much action is ultimately needed.
Today’s PPI will put those views against the hard data. A softer print might reinforce the disinflation signal from CPI, while a hotter core reading might show that higher business costs are beginning to work their way into official inflation measures.
Bitcoin Is Testing Its Last Strong Support Before the July Low
BTC was trading around $63,800 at the time of writing. The 50-day SMA near $63,400 and the 0.236 Fibonacci retracement at $63,600 form the main support area directly underneath price.
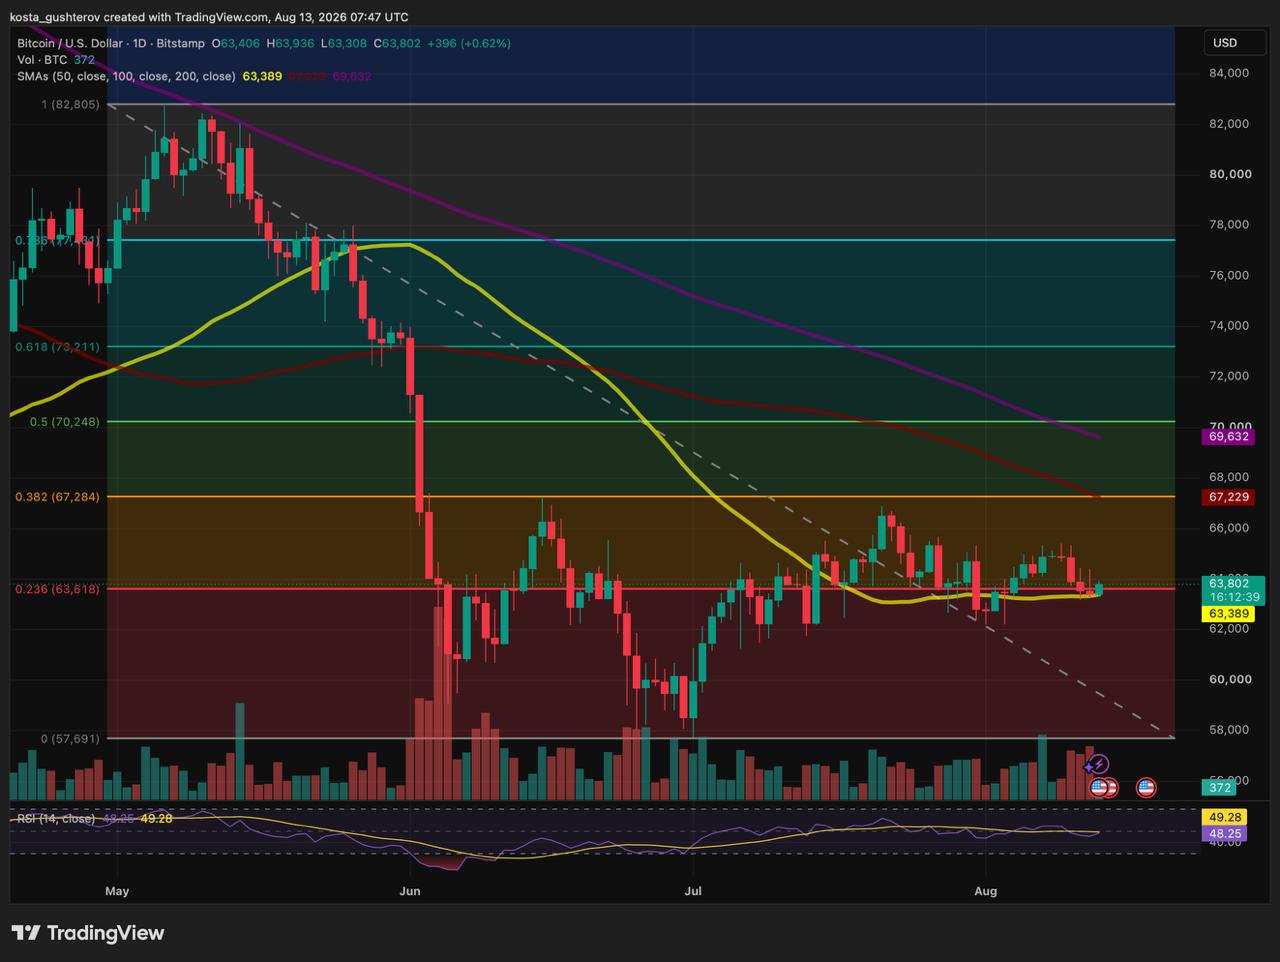
This is the last strong daily-chart confluence before the July swing low around $57,500-$57,700 while smaller reaction levels might appear in between.
Resistance is concentrated around $67,200-$67,300, where the 100-day SMA near $67,200 almost matches the 0.382 Fibonacci retracement close to $67,300.
Bitcoin has therefore reached the PPI release with both sides of the immediate range clearly marked.

PPI Might Decide Which Side Bitcoin Tests Next
A softer PPI print would fit the direction established by Wednesday’s CPI and might give buyers more reason to keep defending the current support. If the market reads the two reports together as evidence that inflation pressure is easing, BTC might turn back toward the $67,200 area.
A hot report would arrive with much worse technical timing. Stronger producer inflation, especially in the core reading, might revive concerns that price pressures remain sticky even as headline CPI cools. If that pushes yields or the dollar higher, Bitcoin would be absorbing the macro pressure while already leaning on its main nearby support.
A print close to expectations might leave the setup largely unchanged. Yesterday’s CPI would still lean softer, but without a second inflation surprise there might be little reason for traders to force BTC through either side immediately.
For now, the chart is unusually clean: support sits near $63,500, resistance near $67,200, and PPI arrives directly between them.
- Update 13:00 UTC
The data has since been released, with headline PPI coming in flat while underlying inflation remained firmer. Our follow-up looks at what the PPI report means and what crypto investors should monitor next.
- Disclaimer: This article is for informational purposes only and does not constitute financial or investment advice. Cryptocurrency markets are highly volatile, and readers should conduct their own research before making investment decisions.



Alex is Editor-in-Chief of Coindoo and co-founder of Millennial Media Group, with nearly a decade of experience covering financial markets - crypto first, then everything else. It started in 2016 with Bitcoin. Like most people at the time, he didn't fully understand it - so he kept digging. Blockchain, tokenomics, the projects, the cycles. That curiosity never stopped, and eventually pulled him into traditional markets too: equities, commodities, macro. Not because he left crypto behind, but because you can't properly understand one without the other. What drives him is straightforward: he wants to know why something is happening, not just that it's happening. Most market coverage stops at the headline - price up, price down, here's a chart. Alex finds that kind of reporting actively unhelpful. If you walk away from an article without understanding the mechanism behind the move, what did you actually learn? He holds a degree in Tourism from New Bulgarian University - not the most obvious path into financial markets, but markets have a way of pulling in people who are simply too curious to stay out. He has authored over 200 in-depth analyses and more than 10,000 articles across crypto and traditional finance. He still thinks every day in markets teaches him something new. That's probably why he hasn't stopped.