Ethereum’s 19% Surge Breaks $2,200 – Can It Reach $2,500?

Ethereum surged 19.4% on the day to trade near $2,290, breaking out of its sub-$1,900 consolidation and moving above its 50-, 100- and 200-day simple moving averages.
The move also changed the daily technical map: $2,100 has shifted from resistance to the first level buyers need to defend. The bigger test now sits on the weekly chart, where ETH is approaching resistance it has yet to clear.
The daily breakout put $2,100 below price
Before the rally, ETH had been trading between roughly $1,870 and $1,900. The daily 50-day and 100-day SMAs sat near $1,865, while the 200-day SMA stood at $2,000
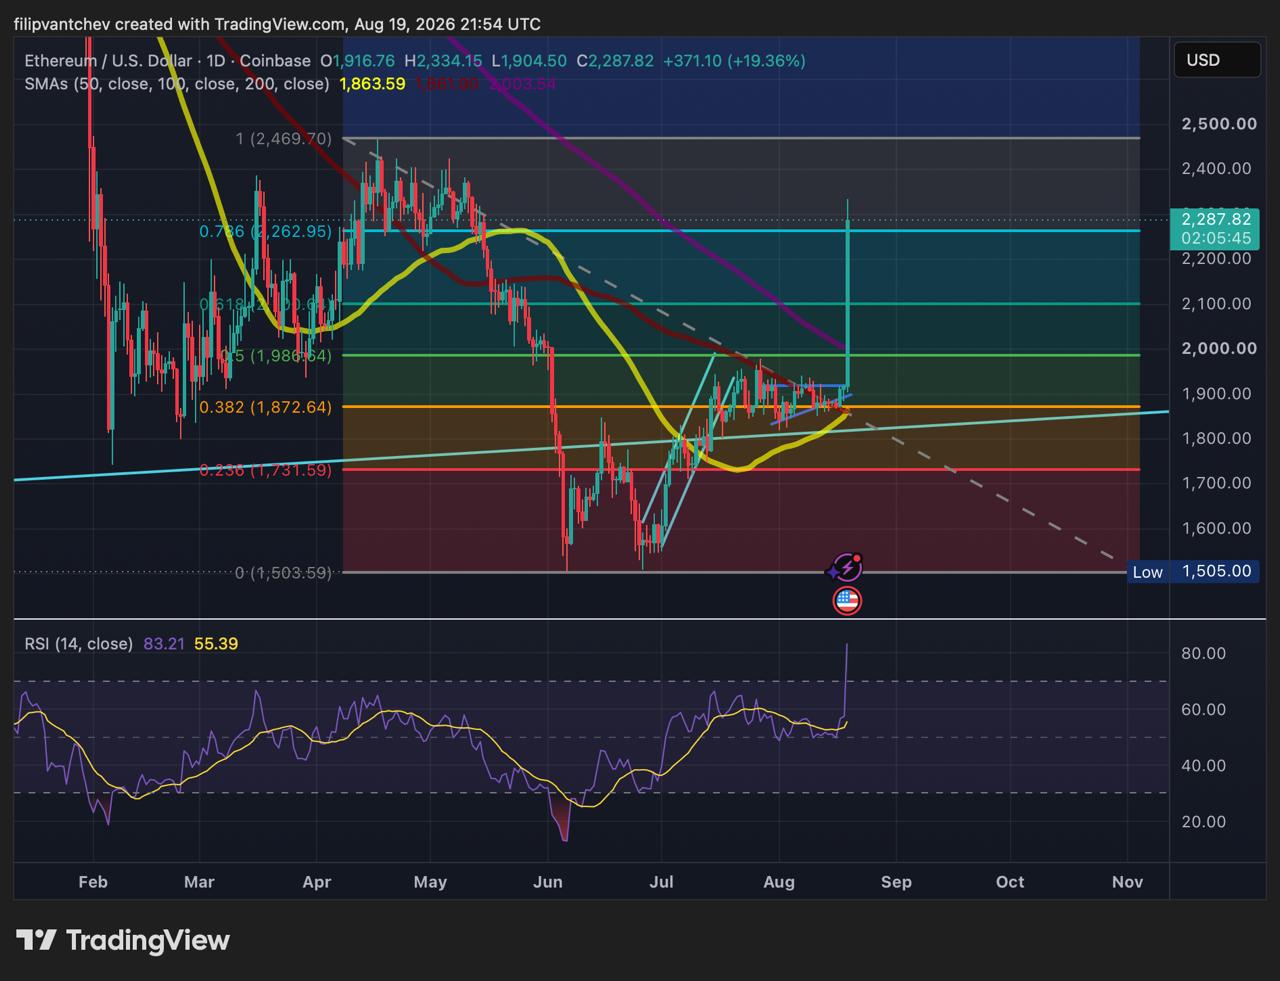
Price moved through each of those averages, reclaimed the 0.5 Fibonacci level at $1,985, and then crossed the 0.618 Fibonacci level at $2,100. ETH also traded above the 0.786 retracement at $2,260, though the daily candle was still open at the time of writing.
That leaves $2,100 as the first level buyers need to defend on a pullback. Below it sits a support band between $2,000 and $1,990, where the daily 200 SMA meets the 0.5 Fibonacci level. A deeper reversal might return attention to the $1,873-$1,900 area that capped ETH during the earlier consolidation.
The weekly chart puts $2,340-$2,400 in the way
Bitfinexs weekly chart showed ETH near $2,290, below all three weekly moving averages: the 200-week SMA at $2,490, the 50-week SMA at $2,620 and the 100-week SMA at $2,760.
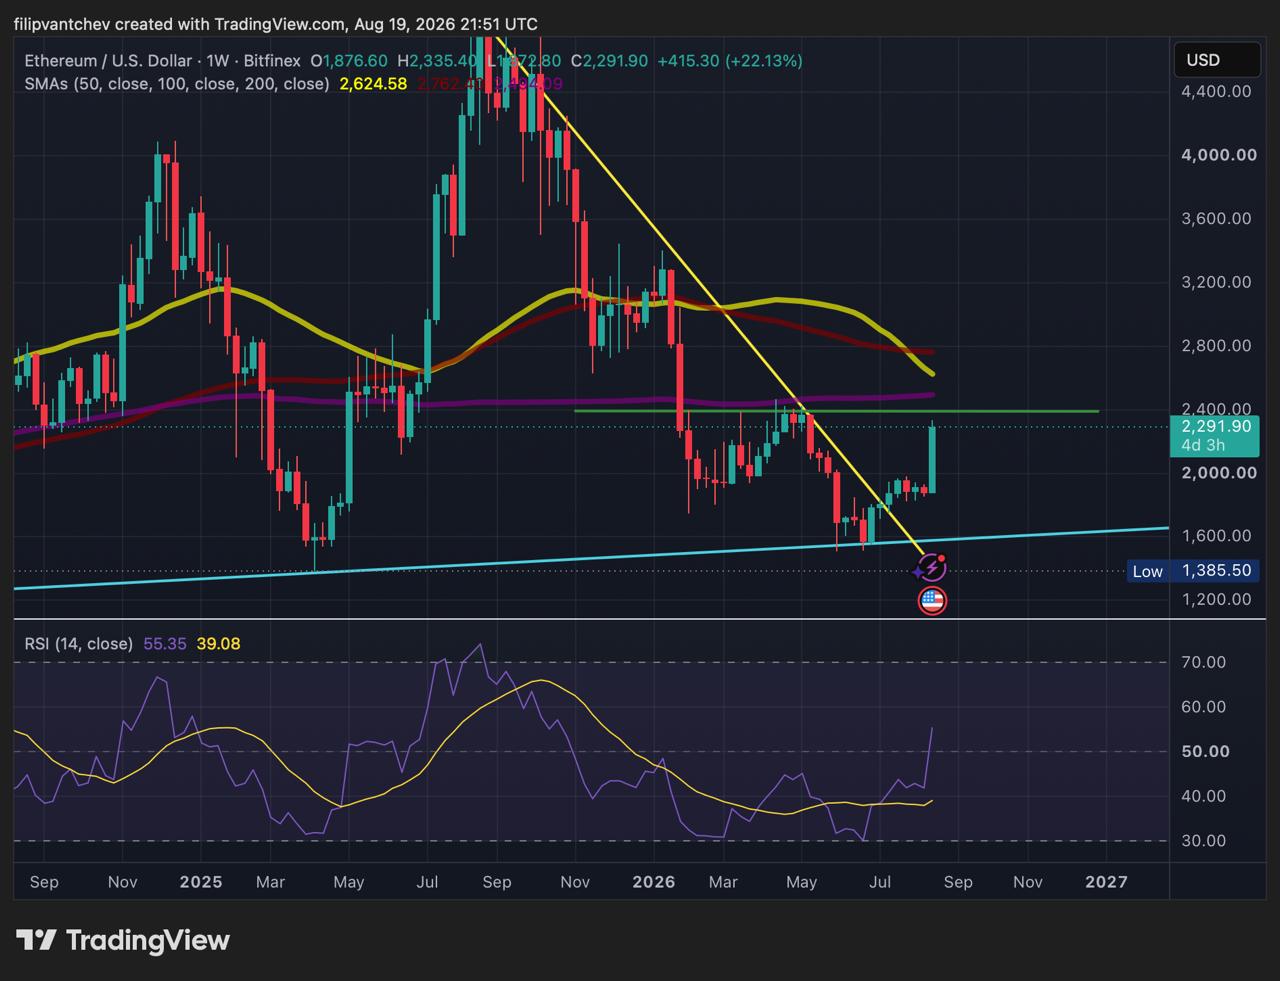
As we can see on the chart there is a a horizontal resistance area around $2,340-$2,400, where a descending trendline also meets price. A weekly close above that zone would leave the $2,470 daily Fibonacci level and the $2,490 weekly 200 SMA as the next concentrated resistance area.
Can ETH reach $2,500?
ETH first needs to turn its breakout levels into confirmed support. A pullback that holds above $2,260 would show that the 0.786 Fibonacci level has changed from resistance into a base for another advance. The stronger confirmation comes from a weekly close above the $2,340-$2,400 resistance area.
The wider market also matters. ETH is moving alongside gains in Bitcoin, Solana and XRP, which gives the rally a broader risk-on backdrop instead of leaving Ethereum to push through resistance alone. That does not guarantee a continuation, but it reduces the risk that ETH is attempting a breakout while the rest of the market is weakening.
$2,500 will still be difficult. The $2,470 daily Fibonacci level and the $2,490 weekly 200 SMA sit only $20 apart, creating a narrow resistance cluster where the recent 19% advance can meet profit-taking. A move into that zone would not by itself confirm a larger weekly reversal; ETH would need to hold above it before the higher weekly averages at $2,620 and $2,760 become relevant.
What the chart needs to show next
| Price behaviour | Technical reading |
|---|---|
| Weekly close above $2,400 | Would put $2,470–$2,490 resistance in play. |
| Pullback holds above $2,260 | Would keep ETH above the 0.786 Fibonacci level. |
| Loss of $2,100 | Would expose the $2,000–$1,990 support band. |
| Loss of $1,990 | Would reopen the $1,870–$1,900 consolidation area. |
The daily move has carried ETH above all three daily averages. The next proof point sits higher: whether the market can close above the weekly $2,340-$2,400 resistance zone without losing $2,100 on a pullback.
Source review: Daily levels are based on the Coinbase ETH/USD chart captured at 21:54 UTC on August 19, 2026. Weekly levels are based on the supplied Bitfinex ETH/USD chart captured at the same time. The charts use different exchanges, so nearby values are treated as zones rather than exact universal prices. The article is provided for informational purposes only and does not constitute investment advice.



Kosta has reported on cryptocurrency markets and blockchain infrastructure since 2020, bringing over six years of hands-on experience in the crypto industry built through daily tracking of markets, trends, and emerging blockchain developments. Specializing in Bitcoin on-chain analysis, institutional ETF flows, and digital asset price action, his work at Coindoo has been cited by other news agencies and consistently covers market developments with a focus on data-driven reporting across Bitcoin, Ethereum, Solana, and XRP. Over the years, Kosta has contributed to multiple crypto media outlets in different regions, authoring over 6,000 articles across the sector. His reporting spans cryptocurrency markets and the broader fintech industry, tracking not only price action but also the technological and regulatory forces shaping the ecosystem. To support his analysis, Kosta actively leverages on-chain data and metrics from leading platforms such as Santiment, Glassnode, and CryptoQuant, enabling deeper, evidence-based market insights. He believes in the power of transparency and the data that underpins the blockchain ecosystem. His academic background in Marketing Management from Denmark further complements his analytical approach, adding a strong understanding of communication strategy and content positioning to his work.