XRP Price Breaks Its Downtrend – What Confirms the Move?

XRP has broken above descending channels on its daily and weekly charts, but resistance at $1.42 and bearish weekly averages leave the move short of confirmation.
Key Takeaways
- XRP cleared both descending channel boundaries.
- $1.42 is the first daily resistance.
- $1.34 is the first major support.
- Weekly moving averages remain bearish resistance.
- ETF inflows slowed sharply after August.
XRP clears both downtrend channels
The daily and weekly XRP/USD charts show XRP above the descending boundaries that contained its decline, while trading near $1.41 at the time of writing. This interrupts the previous pattern of failing beneath the channel ceiling, but it does not confirm a broader reversal.
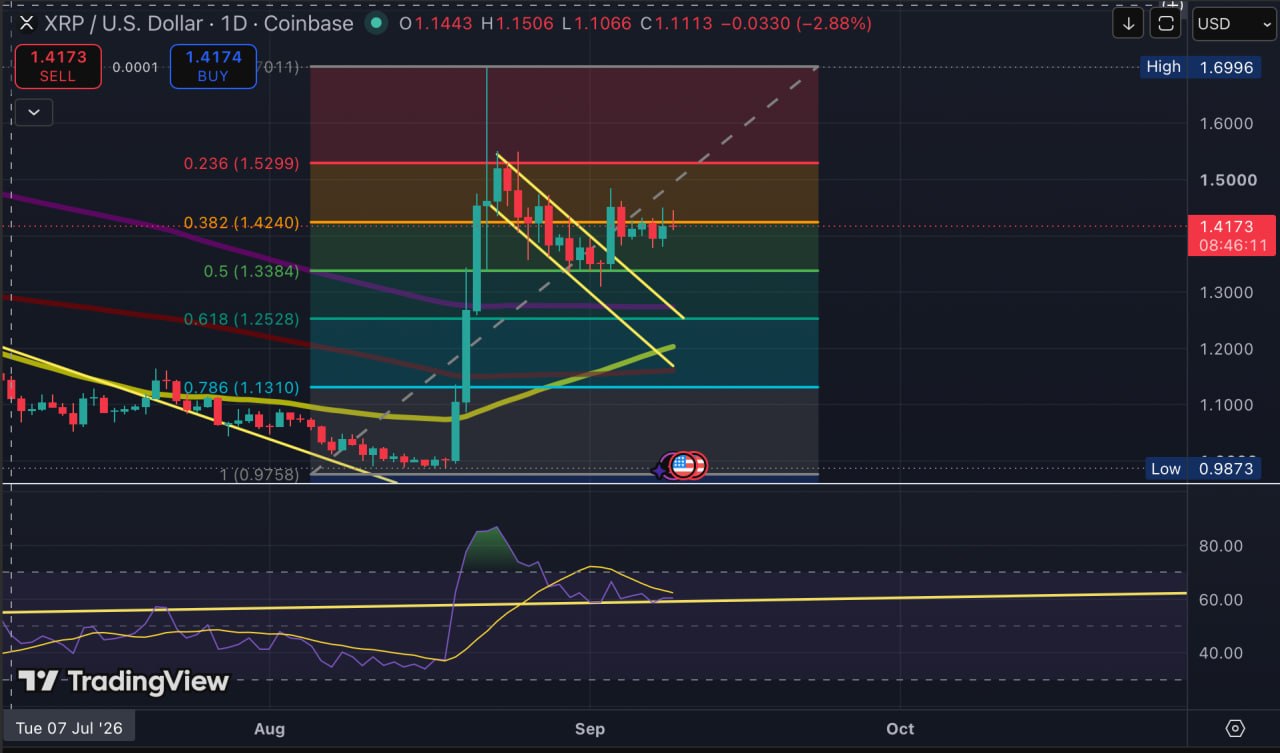
There are two different stages of confirmation. Holding a retest of the former channel ceiling would confirm the immediate breakout. Reclaiming the weekly moving averages would be required to establish a wider trend reversal.
The first test comes if XRP returns to the broken channel boundary. A successful hold could turn previous resistance into support. A close back inside the channel would leave the move vulnerable to being treated as a failed breakout.
The weekly averages still favor the bearish case
XRP remains below its 50-week and 100-week simple moving averages, leaving two areas of dynamic resistance above the current price. The averages track weekly closing prices across extended periods and are widely used as longer-term trend markers.
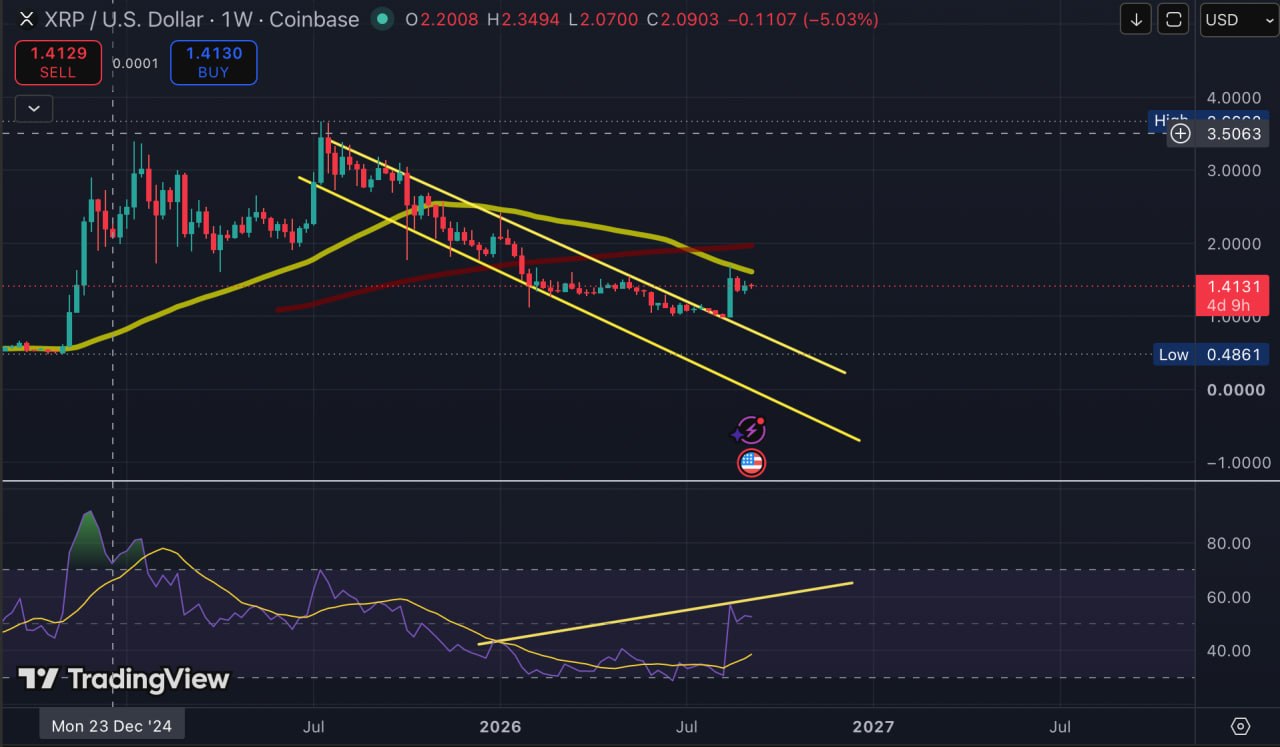
The 50-week average has also crossed below the 100-week average. The crossover shows that the average closing price over the latest 50 weeks has fallen below the 100-week average, confirming that the more recent trend has been weaker but it is still a lagging record of the decline rather than a prediction of XRP’s next move.
RSI shows that selling momentum weakened
XRP recorded a lower price low during the decline, while weekly RSI formed a higher low. The bullish divergence indicates that selling momentum weakened into the later low, although price still needs to hold the channel breakout before the signal gains technical confirmation.
The daily chart puts $1.42 first
A daily close above $1.42 would clear the immediate barrier and bring the 0.236 retracement near $1.5299 into focus. Beyond that, XRP would face $1.70, where its August rally ended. A daily close and successful retest would carry more weight than another brief move through the level.
$1.34 is the first major downside test
If XRP reverses from $1.42, the 0.5 retracement near $1.33 becomes the first major support. A hold there would keep XRP above the midpoint of its July-to-August advance.
A close below $1.33 would expose the 0.618 retracement near $1.25. The decline would become more damaging if it also returned XRP inside the descending channel.
ETF demand remains positive but has slowed
SoSoValue data showed approximately $18.96 million in net inflows for U.S. spot XRP ETFs during the week ending September 4, down from $110.49 million in the previous week. The products subsequently recorded about $1.55 million on September 8.
The flows remain positive, but their smaller size means ETF demand is offering less support than it did before the move to $1.70. A renewed increase alongside a break above $1.42 would provide stronger evidence that fund buying is supporting the recovery.
READ MORE:

Germany Eyes 25% Crypto Tax From 2027
The XRPL fix would be a secondary catalyst
The XRP Ledger could activate its fixCleanup3_3_0 amendment around September 11 if validator support remains above the required threshold. As explained in our report on the approaching XRPL fix, the amendment addresses transaction-handling issues affecting vaults, automated market makers and permissioned trading.
Successful activation could improve the reliability of existing infrastructure, but it would not introduce a new XRP use case or create automatic demand for the token. Any immediate price effect is therefore likely to be limited and indirect.
Its practical value should be judged by whether affected applications report fewer failed or inconsistent transactions after activation.
What confirms the XRP move?
The evidence is mixed. XRP has broken above its daily and weekly descending channels, and the bullish RSI divergence suggests that selling momentum has weakened. The bearish crossover between the 50-week and 100-week moving averages, resistance above the current price and weaker ETF inflows show that the broader trend has not yet reversed.
A successful retest of the former channel ceiling would provide the first confirmation that buyers can defend the breakout. A daily close above $1.42 would strengthen that signal and expose $1.53, followed by the more important resistance near $1.70. XRP would still need to reclaim its weekly moving averages before the advance could be treated as a broader trend reversal.
Macroeconomic data could help determine the next move. This week’s U.S. inflation releases are among the events that could move crypto markets, with producer-price data due on September 10 and consumer-price data on September 11. Softer inflation could support risk appetite, giving XRP a better chance of holding its breakout. Stronger inflation could lift the dollar and Treasury yields, increasing pressure on XRP and other risk assets.
The data may provide the catalyst, though the chart will show whether the move holds. A return inside the descending channel would weaken the breakout. A subsequent loss of the $1.33 support would shift attention toward $1.25 and indicate that the recent improvement failed to produce a sustained reversal.
This article is for informational purposes only and does not constitute financial advice.



Kosta has reported on cryptocurrency markets and blockchain infrastructure since 2020, bringing over six years of hands-on experience in the crypto industry built through daily tracking of markets, trends, and emerging blockchain developments. Specializing in Bitcoin on-chain analysis, institutional ETF flows, and digital asset price action, his work at Coindoo has been cited by other news agencies and consistently covers market developments with a focus on data-driven reporting across Bitcoin, Ethereum, Solana, and XRP. Over the years, Kosta has contributed to multiple crypto media outlets in different regions, authoring over 6,000 articles across the sector. His reporting spans cryptocurrency markets and the broader fintech industry, tracking not only price action but also the technological and regulatory forces shaping the ecosystem. To support his analysis, Kosta actively leverages on-chain data and metrics from leading platforms such as Santiment, Glassnode, and CryptoQuant, enabling deeper, evidence-based market insights. He believes in the power of transparency and the data that underpins the blockchain ecosystem. His academic background in Marketing Management from Denmark further complements his analytical approach, adding a strong understanding of communication strategy and content positioning to his work.