Stablecoin Flows Go Quiet: A Structural Market View

Stablecoin exchange activity has dried up in both directions, near its lowest since July 2025, after one large May outflow that hasn't returned since.
Key Takeaways
- Stablecoin inflows and outflows are both near their lowest since July 2025.
- This is activity drying up on both sides, not a one-sided exit.
- Binance shows a mild net-negative reading of -$89.3M.
Stablecoin flows are often read as a proxy for sidelined buying power, the cash waiting on exchanges to move into crypto. Right now, four different flow charts tell a more specific and more neutral story than “money is leaving” or “money is arriving.” Across exchanges, stablecoin activity has simply gone quiet, in both directions at once.
Activity Has Compressed on Both Sides
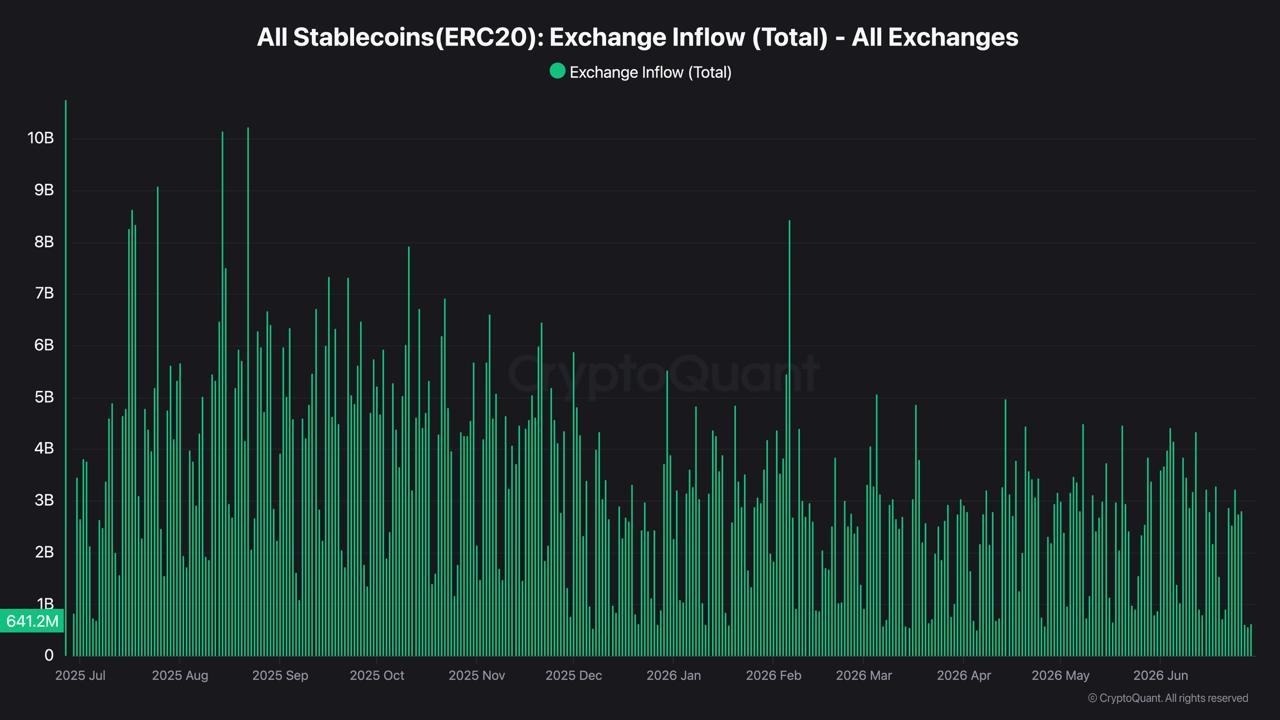
The clearest signal comes from looking at inflows and outflows together. Total stablecoin outflows from all exchanges currently read $713.2M, and inflows read $641.2M, and both figures sit near the lowest levels in the dataset going back to July 2025. That timing matters: peak activity on both sides was concentrated in the July-to-September 2025 window, when outflow bars regularly hit $8B to $10B or more. Since then, both inflows and outflows have compressed steadily, with the recent June readings among the lowest on record.
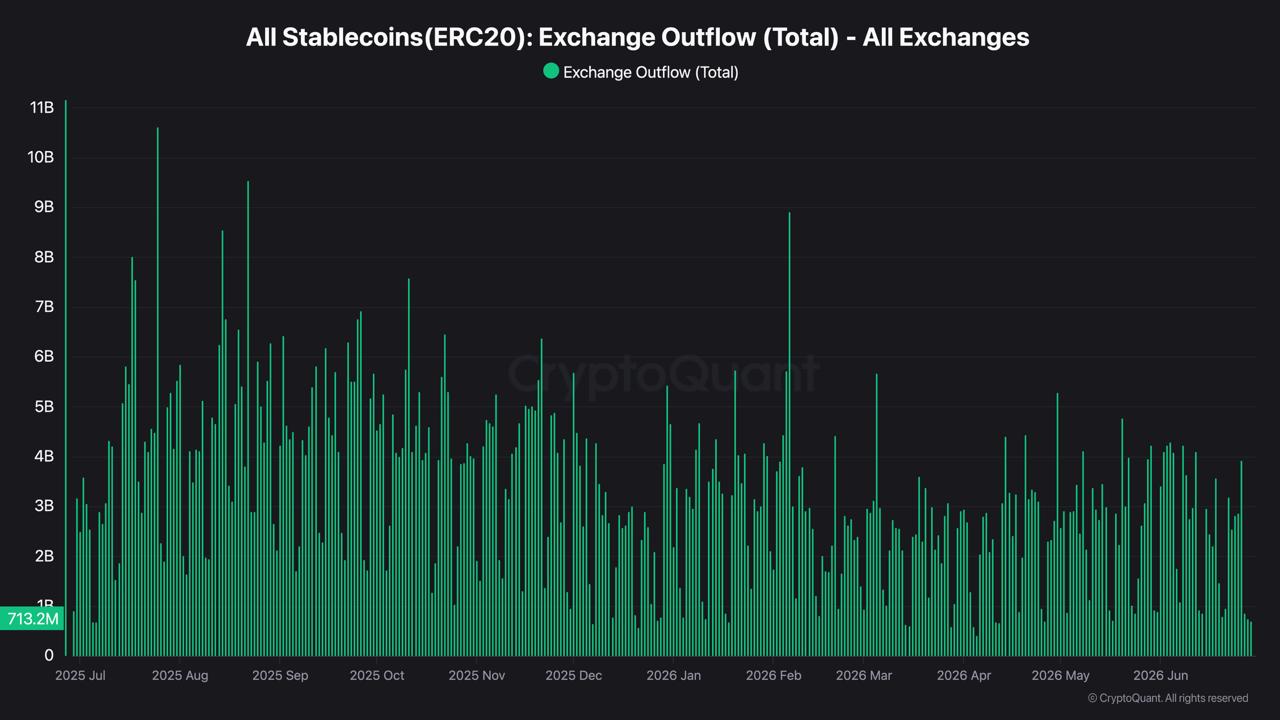
The important read is what that combination means. When outflows alone fall, you might call it stablecoins staying put; when inflows alone fall, you might call it buying power drying up. But both falling together points to something different: the stablecoin market on exchanges has gone quiet overall, not made a one-sided move. The liquidity that was actively cycling through exchanges during the mid-2025 bull period simply isn’t present at that scale anymore.
Binance Confirms the Drift
Zooming into Binance specifically, the longest-timeframe view (October 2023 to June 2026) backs this up. Current netflow there reads -$89.3M, meaning slightly more stablecoins are leaving than entering.
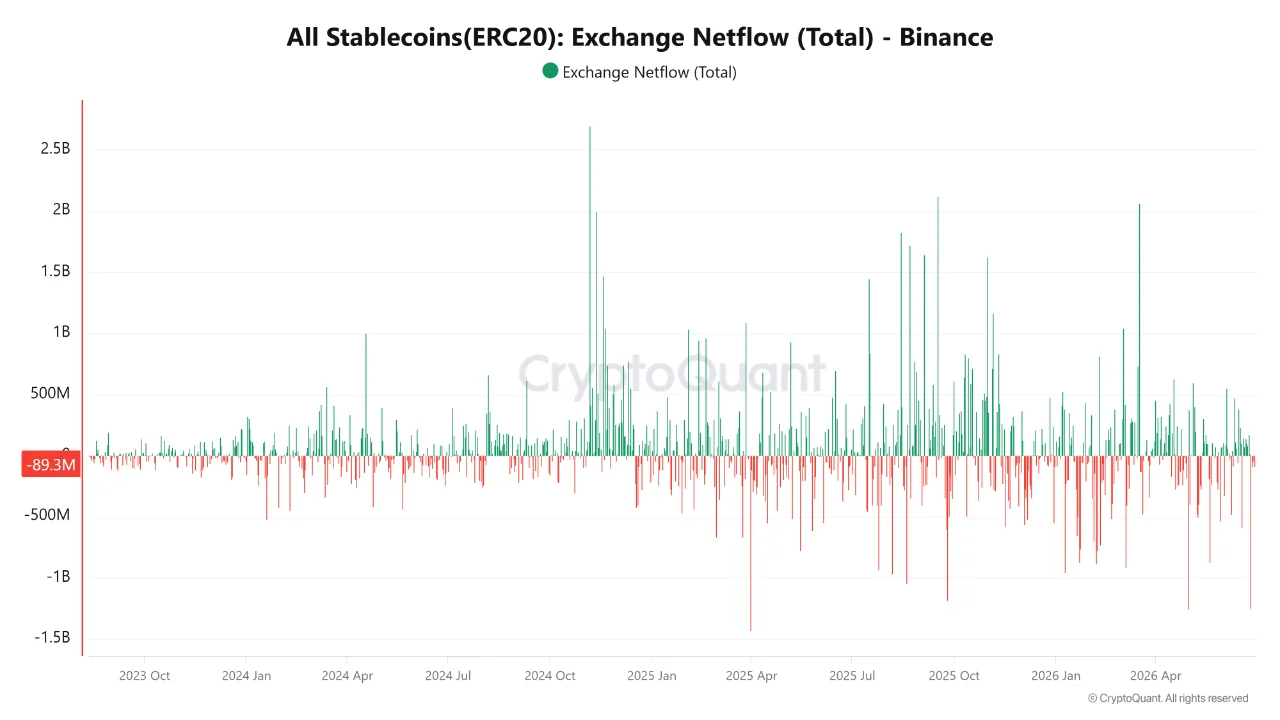
The chart’s history is noisy, with large positive inflow spikes a recurring feature, the biggest being a $2.5B-plus spike around January 2025, but the recent weeks show those positive spikes shrinking and the negative bars becoming more consistent. The current reading is modest and only slightly negative, nothing extreme on its own, but the directional drift is toward net outflow, consistent with the broader picture.
A Sustained State, Not a One-Day Event
The netflow chart with a 50-period moving average makes clear this is structural rather than a blip. Current all-exchange netflow reads -$71.9M, and the SMA50 has been hugging just below zero since roughly early 2026, confirming a sustained drift to slightly net-negative.
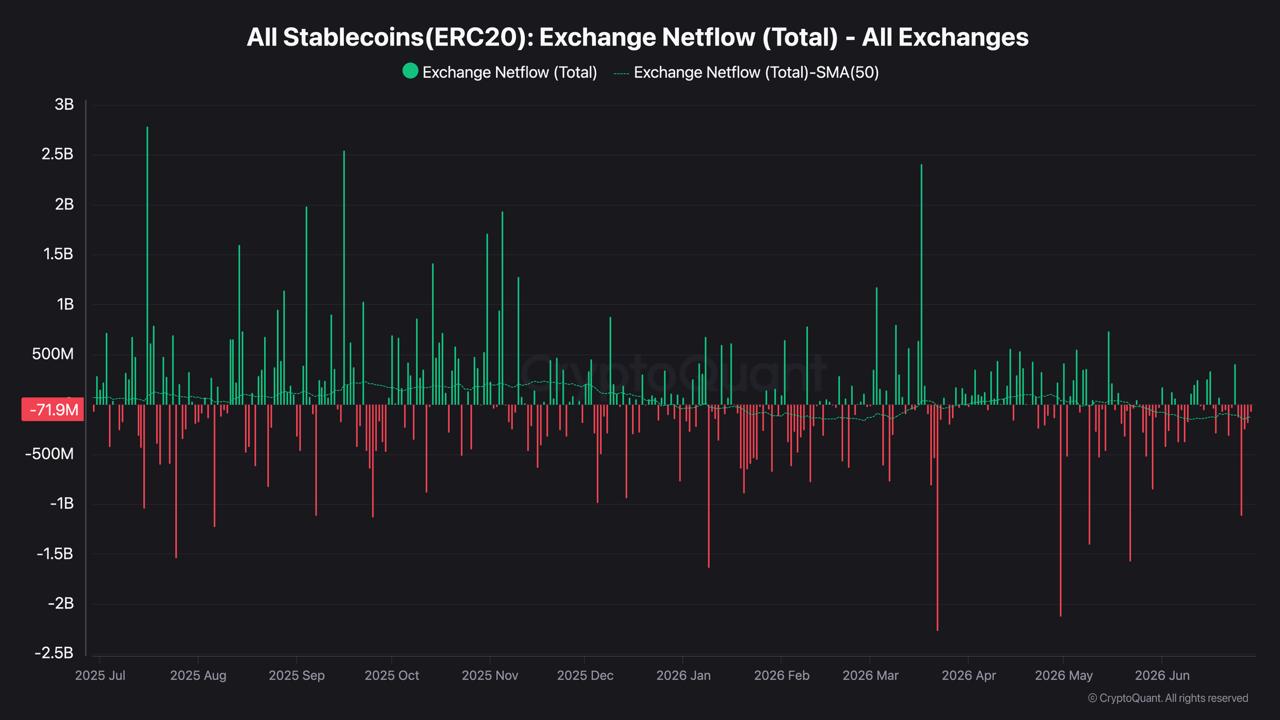
The most significant events highlighted on the 2026 chart are the large positive spike on March 19 ($2.3 billion) and the largest single-day negative flow shortly thereafter – on March 22 ($2.26 billion), followed by another similar one on April 30, which reached $2.12 billion. In both cases, these are short-term deviations rather than a general shift in the trend. Afterward, the flow returned to the low-amplitude range that dominated throughout 2026.
April 30 in Context
That April 30 reading of -$2.12B is worth noting precisely because of what followed: June flows have remained in the quiet, low-amplitude range rather than recovering toward the active levels of mid-2025. On a daily chart, a single bar of that size reflects one day’s net movement and cannot be attributed to a specific cause from the chart alone. What it does mark is the last point of significant stablecoin exchange activity in the dataset, after which the compression that had been building since late 2025 settled into the near-flat baseline visible through June.
Putting the four charts together, the accurate conclusion is more neutral than a typical flow headline would suggest. This isn’t stablecoins fleeing exchanges, and it isn’t specifically buy-side liquidity vanishing. It’s that the entire stablecoin flow ecosystem on exchanges, both the buying power coming in and the redemptions going out, has contracted at the same time. Binance’s mild net-negative reading and the SMA50 sitting near zero with a slight downward bias both fit that picture: a market that has gone still rather than one moving decisively in either direction.
What that means for direction is genuinely open. The current lull in market activity could develop in two directions, it could be a pause before a new influx of liquidity, or a clear sign that market participants prefer to wait for clearer macroeconomic conditions, such as an official agreement between Iran and the U.S. that addresses all aspects of the conflict.

Alexander Zdravkov is a market analyst and crypto journalist with interests in economics, broader financial markets and digital assets. His journey into crypto began more than four years ago, driven by a fascination with the rapid evolution of blockchain technology and the transformative potential of decentralized finance. He began analyzing market cycles and identifying emerging trends before they reach the mainstream. He holds a degree in International Relations - a background that helped shape his broader perspective on global economics, geopolitics, and the interconnected nature of modern financial markets. Whether covering the latest developments in the crypto sector or exploring broader macroeconomic themes, Alexander focuses on giving readers context rather than simply repeating headlines. During his career, he has authored more than 5,000 articles covering cryptocurrencies, traditional finance, and global market developments. His work spans everything from Bitcoin and altcoins to macroeconomic trends influencing risk assets worldwide.