Solana Crosses $94, but $5.8B Is Still on the Line

Solana surged past $94 and briefly traded above $100 on Friday, but derivatives activity, not an equally strong wave of spot buying, is now shaping this breakout.
Solana clears major technical levels
The daily SOL/USD chart shows a reversal from the $74 area, which coincides with the 0.382 Fibonacci retracement. From there, Solana reclaimed its 50-day ($77) and 100-day ($76) moving averages, then moved above the 200-day average at $81.
That opened the way to $83 and, ultimately, the psychological $90 level. SOL broke above the $90 resistance and reached $102 before pulling back to around $94. The rejection near $100 shows that sellers are still active above the breakout zone.
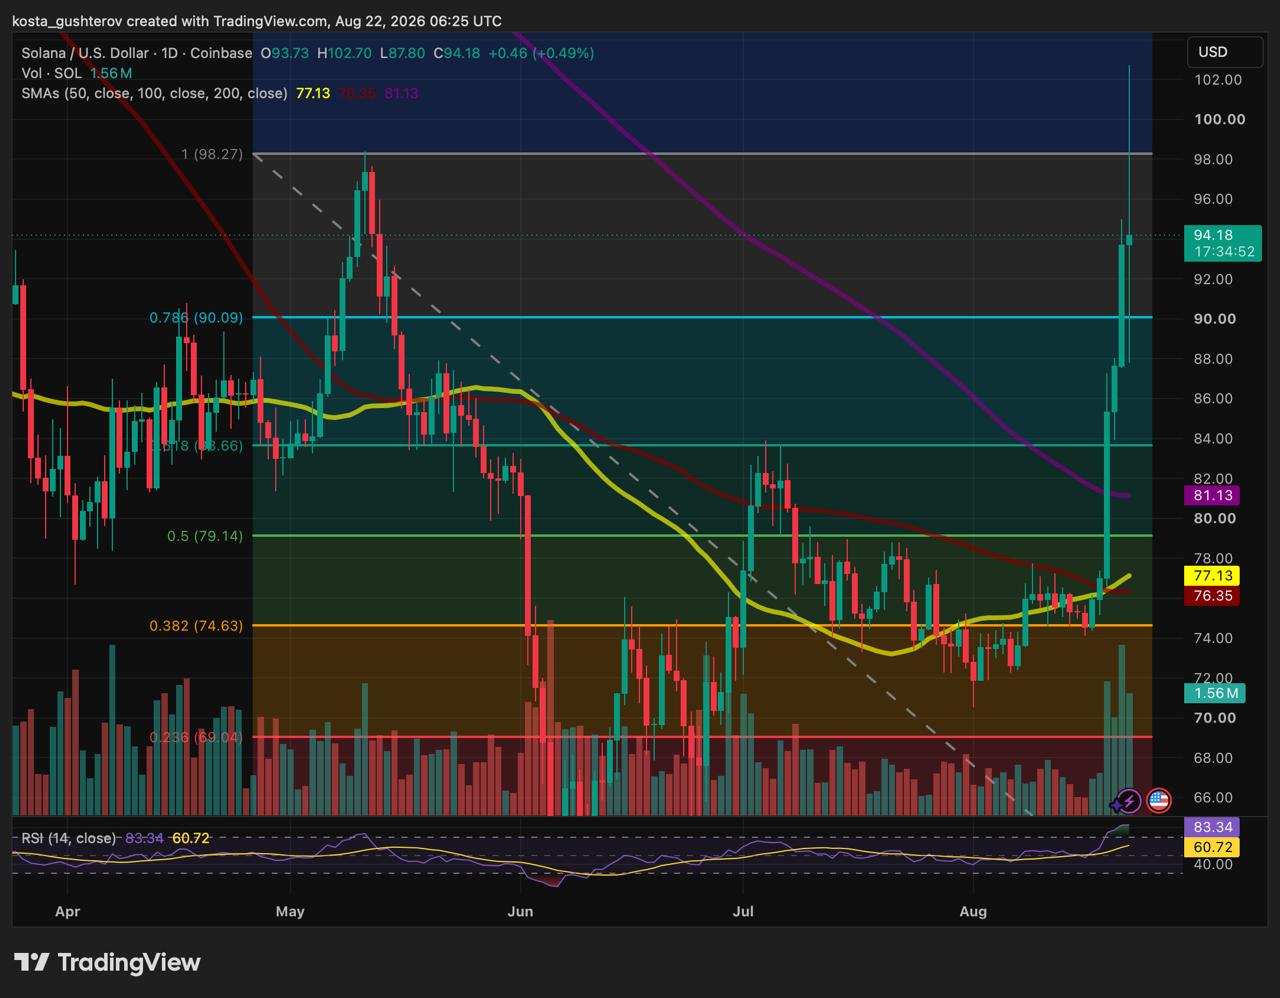
A daily close above $90 would strengthen the breakout case. If SOL falls back below that level, attention shifts to $83, then $79 and the moving-average cluster beneath it.
- $98: The next Fibonacci resistance above the $90 breakout area.
- $90: Former resistance that now needs to hold as support.
- $83: First meaningful support if SOL loses $90.
- $79: Fibonacci support near the reclaimed moving averages.
- $74: The base of the latest advance and the key support on the chart.
The daily RSI reached 83, placing SOL firmly in overbought territory. Strong trends can keep the indicator elevated, but the higher it climbs, the greater the risk of abrupt intraday pullbacks.
Futures activity is far ahead of spot demand
CoinGlass showed SOL near $94, up 4.28% over 24 hours and 25.3% over the week. Futures volume reached roughly $19.33 billion, while spot turnover was only $1.88 billion.
That is slightly more than $10 in futures trading for every dollar traded on the spot market. Derivatives normally generate larger turnover because of hedging and leverage, but this gap leaves the move more sensitive to liquidations and sudden changes in positioning.
- Futures volume – $19.33B: Speculative activity is driving much of the current trading flow.
- Spot volume – $1.88B: The cash market has not kept pace with derivatives turnover, leaving thinner support during a pullback.
- Open interest – $5.81B: A large amount of leveraged exposure remains active in SOL futures.
- 24-hour liquidations – $108.35M: The move has already forced out a significant number of overextended traders.
What the positioning says about sentiment
The liquidation data confirms that the rally has not been orderly. Short covering helped accelerate the move higher, while the remaining open interest leaves SOL exposed if late longs begin exiting at the same time.
Funding rates are the next important signal. In perpetual futures, positive funding means longs pay shorts. Modestly positive funding is common during a rally, but rapidly rising funding alongside expanding open interest would point to a crowded long trade and raise the chance of a sharp flush.
Traders can track that balance through CoinGlass’s SOL funding-rate dashboard, alongside open interest and liquidation data.
What matters next
- Price: SOL needs to hold $90 on a daily closing basis and absorb selling during any retest.
- Open interest: A modest pullback with flat or declining open interest would suggest profit-taking rather than a broader leverage unwind.
- Funding: Funding should remain controlled; a sharp rise would show that longs are becoming too concentrated.
- Spot demand: Stronger spot participation would give the breakout a more durable base than futures-led buying alone.
Solana has cleared its main technical barrier, but the breakout is now entering its harder phase. The $90 area is the line buyers need to defend, while the large futures imbalance leaves little room for complacency if momentum slows.
Methodology: Price structure, Fibonacci levels, moving averages and RSI are taken from the supplied Coinbase SOL/USD daily chart created on August 22, 2026, at 06:25 UTC. Market data is from CoinGlass’s SOL overview, reviewed on August 22; crypto prices, volume, open interest and liquidations change continuously. Funding-rate mechanics are described using CoinGlass’s SOL funding-rate page. The article is provided for informational purposes only and does not constitute investment advice.



Kosta has reported on cryptocurrency markets and blockchain infrastructure since 2020, bringing over six years of hands-on experience in the crypto industry built through daily tracking of markets, trends, and emerging blockchain developments. Specializing in Bitcoin on-chain analysis, institutional ETF flows, and digital asset price action, his work at Coindoo has been cited by other news agencies and consistently covers market developments with a focus on data-driven reporting across Bitcoin, Ethereum, Solana, and XRP. Over the years, Kosta has contributed to multiple crypto media outlets in different regions, authoring over 6,000 articles across the sector. His reporting spans cryptocurrency markets and the broader fintech industry, tracking not only price action but also the technological and regulatory forces shaping the ecosystem. To support his analysis, Kosta actively leverages on-chain data and metrics from leading platforms such as Santiment, Glassnode, and CryptoQuant, enabling deeper, evidence-based market insights. He believes in the power of transparency and the data that underpins the blockchain ecosystem. His academic background in Marketing Management from Denmark further complements his analytical approach, adding a strong understanding of communication strategy and content positioning to his work.