HYPE Price Faces Its First Major Test After the $77 Bounce

HYPE has bounced from the mid-$70s, but the recovery now depends on whether buyers can push through a resistance area that combines a channel boundary and a daily Fibonacci level.
HYPE has recovered from $77 support, but bearish momentum divergence and overlapping resistance near $80.50 leave the next daily close as the decisive technical test.
Key Takeaways
- HYPE bounced from overlapping support near $77.
- Bearish four-hour RSI divergence now warns buyers.
- HYPE traded near $80.50 at writing.
- Channel and Fibonacci resistance converge near $81.
- Next resistance spans $81.50 to $84.
HYPE rebounds into a crowded resistance zone
HYPE fell toward $77 before the decline slowed. This area combined prior horizontal support, the four-hour 200-period simple moving average and the lower boundary of the descending channel.
No individual technical level guarantees that a price will hold. Their convergence, however, made $77 an area buyers were more likely to defend. The rebound has since carried HYPE to the opposite side of the channel, where resistance is considerably stronger.
Bearish RSI divergence warns of weaker momentum
The four-hour relative strength index, or RSI, has formed a bearish divergence. HYPE’s price produced a higher high during the recovery, while the RSI registered a lower high. This suggests that upward momentum has not strengthened alongside the price.
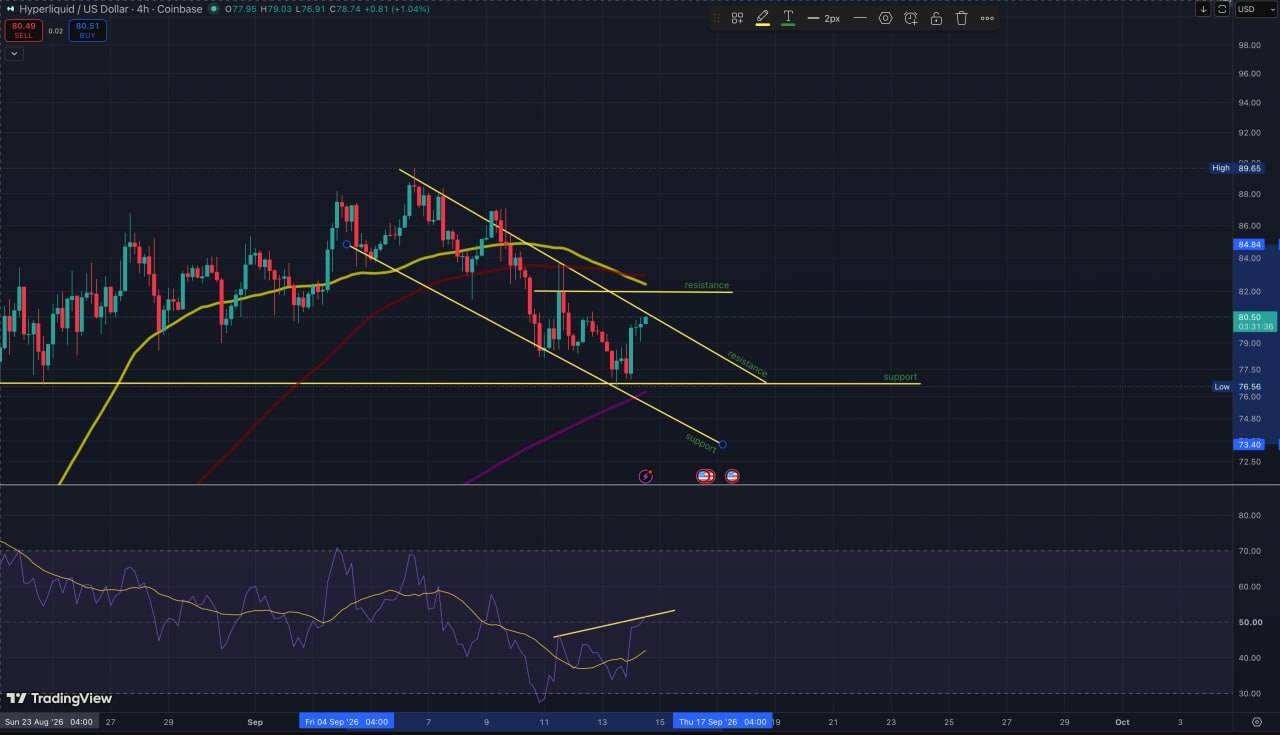
A bearish divergence does not always lead to a decline, but it becomes more relevant when it appears near resistance. A decisive break above the channel would weaken the warning, while rejection from the upper boundary would give it more weight.
Why $80.50-$81 is the decisive resistance
HYPE traded near $80.50 on Coinbase at the time of writing, placing it directly beneath the four-hour channel boundary around $80.50-$81. The daily 0.236 Fibonacci retracement also sits near $80.50.
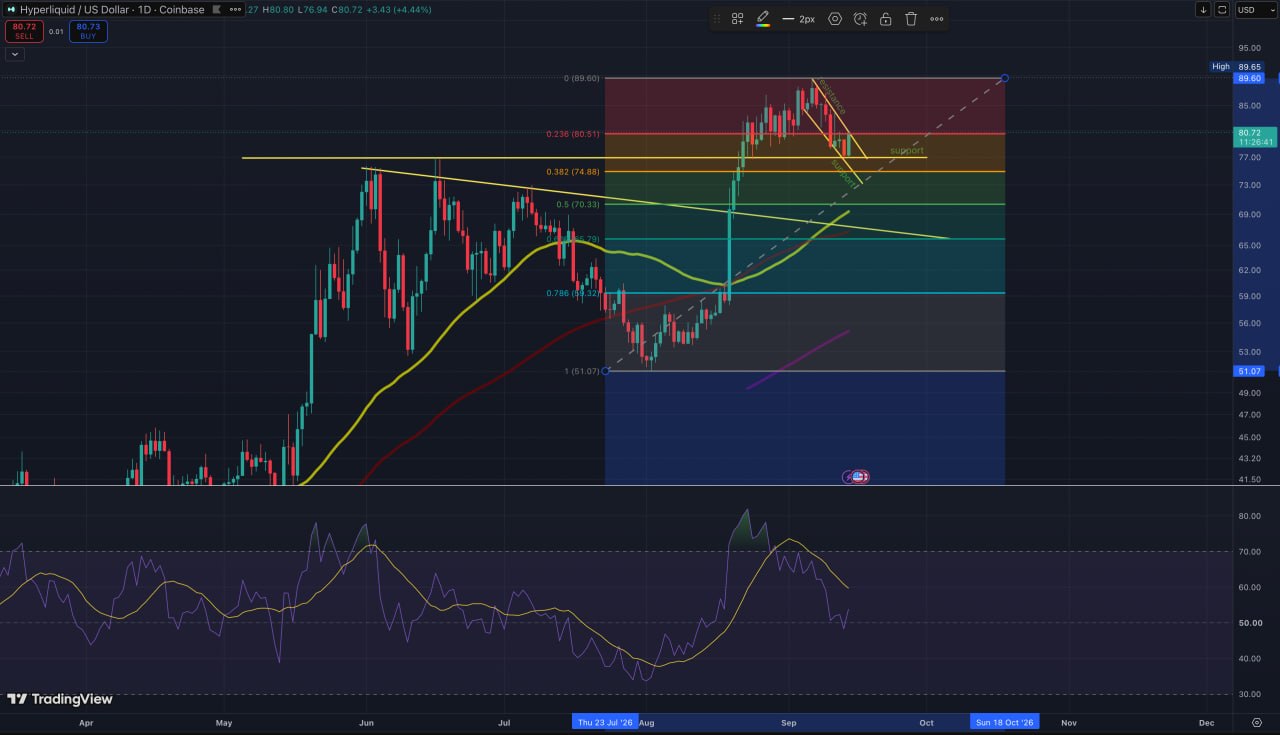
The Fibonacci retracement was drawn on the Coinbase HYPE/USD daily chart from the August swing low near $51 to the subsequent high around $89.60. Measuring that advance places the 0.236 retracement at approximately $80.50, the 0.382 level near $75 and the halfway retracement around $70.33.
These levels show how much of the August advance HYPE has surrendered. Because the price fell below the 0.236 retracement and is now approaching it from underneath, $80.50 is acting as resistance. Rejection from this level would keep the deeper retracements near $75 and $70.33 relevant.
What would confirm a bullish breakout?
To break the short-term downtrend, HYPE first needs a four-hour close above the channel. A daily close above $80.50 would provide stronger confirmation, particularly if a subsequent pullback holds that level as support.
Even then, the price would enter another resistance area between $81.50 and $84, where the four-hour 50- and 100-period simple moving averages are clustered. Buyers would need to clear this entire zone before the recent high near $89.60 becomes relevant again.
Trading volume can help distinguish a sustained breakout from a temporary move above resistance. A close supported by stronger-than-recent four-hour volume would carry more weight than an isolated low-volume candle.
Rejection would return attention to $77
A brief move above the channel followed by a close back inside it would resemble a failed breakout and leave the short-term descending structure intact. Combined with the bearish RSI divergence, that outcome would return attention to the $77 support area.
A decisive break below $77 would expose the daily 0.382 Fibonacci retracement near $75. HYPE has not revisited this level since its August advance, making it a deeper test of the rally. A daily close below $75 would then bring the 0.5 retracement around $70.33 into view.

Broader market events could override the setup
The chart defines HYPE’s immediate decision points, but the breakout attempt will not develop in isolation. Several events this week could change risk appetite across the broader crypto market.
The Senate is expected to hold a procedural cloture vote related to the CLARITY Act on September 15. Attention will then turn to the Federal Reserve’s policy decision.
Our analysis of Bitcoin entering Fed week explains why the guidance provided by policymakers may matter as much as the decision itself. A sharp move in Bitcoin or the broader market could override HYPE’s technical setup before either side establishes control.
HYPE remains at a technical decision point
The rebound has improved HYPE’s short-term position, but it has not yet reversed the descending structure. With momentum weakening near resistance, an intraday move above $80.50 would carry less significance than a confirmed daily close and successful retest.
This article is provided for informational purposes only and does not constitute financial or investment advice. Technical levels can change as market conditions develop.



Alexander Zdravkov is a market analyst and crypto journalist with interests in economics, broader financial markets and digital assets. His journey into crypto began more than four years ago, driven by a fascination with the rapid evolution of blockchain technology and the transformative potential of decentralized finance. He began analyzing market cycles and identifying emerging trends before they reach the mainstream. He holds a degree in International Relations - a background that helped shape his broader perspective on global economics, geopolitics, and the interconnected nature of modern financial markets. Whether covering the latest developments in the crypto sector or exploring broader macroeconomic themes, Alexander focuses on giving readers context rather than simply repeating headlines. During his career, he has authored more than 5,000 articles covering cryptocurrencies, traditional finance, and global market developments. His work spans everything from Bitcoin and altcoins to macroeconomic trends influencing risk assets worldwide.