HYPE Price Analysis: Citrini’s Bull Case Meets a Critical Chart Level

Hyperliquid's HYPE nearly doubled from its May low while $2B in protocol buybacks compress supply. Now price sits at a critical Fibonacci level that could decide the next move.
Key Takeaways
The Setup
HYPE spent most of April and early May consolidating. From April 19 through May 13, the token ground sideways in the $40–$45 range, slowly losing ground amid a broader market lull. On May 13, a sharp flush took price down to $38.17, the local low for the month and the base from which the subsequent impulse began.
What followed was one of the cleaner structural moves in HYPE’s recent history. From that $38.17 floor, the token nearly doubled in roughly 2.5 weeks, peaking around $75.71 in early June. This fast, directional expansion broadly coincided with a wave of institutional attention around Hyperliquid’s fundamental profile, most notably highlighted in a detailed investment thesis published by institutional research firm Citrini.
Why Citrini Is Bullish
Citrini’s core argument for HYPE centers on structural tokenomics that mimic equity value-accrual mechanisms, a rarity in the digital asset space.
More than 90% of platform trading fees flow directly into the protocol’s Assistance Fund, which uses those proceeds to programmatically buy HYPE on the open market. Since Hyperliquid launched in January 2025, those cumulative buybacks have crossed the $2 billion threshold. According to data cited by Citrini Research, this accounts for roughly half of all token buyback activity across the entire crypto space over the past year. Measured against total market capitalization, the buyback rate runs at approximately 7% annually, an aggressive level even by legacy corporate equity standards.
Beyond the ongoing buyback pressure, the Hyperliquid Foundation’s framework formalizes the permanent removal of these tokens from circulating supply, shifting the dynamic from active demand support to hard supply reduction.
Citrini also flags the launch of spot exchange-traded products, such as the Bitwise Hyperliquid ETF (BHYP US), as a long-term structural tailwind. These products bring regulated, institutional visibility to the Layer-1 network, opening up capital pipelines that bypass traditional crypto-native onboarding friction.
The overall picture presents a cash-flow-generating exchange running aggressive protocol-level buybacks alongside a deflationary burn structure, a fundamentally backed framework that remains highly unique in crypto.
Our Analysis: Beyond the Exchange Token
Beyond the immediate tokenomics cited by Citrini, our analysis suggests that HYPE’s transition from an exchange-specific asset to a foundational Layer-1 gas and staking token is being undervalued.
As permissionless smart contracts and native decentralized applications (dApps) launch on Hyperliquid, the utility demand for HYPE expands drastically outside of trading fee mechanics. This transforms HYPE from a pure value-accrual play into a high-utility ecosystem asset.
Where Price Stands Now
Following the rally to $75.71, HYPE has entered a sharp technical retracement. The June 4–5 selloff marked the heaviest volume distribution on the chart, and the subsequent recovery attempts have materialized on noticeably lighter buying volume.
While trading for $61.97 at the time of writing, the price is currently testing a critical inflection point at $61.37 – the 0.382 Fibonacci retracement level. The daily close relative to this level could dictate the asset’s immediate short-term path.
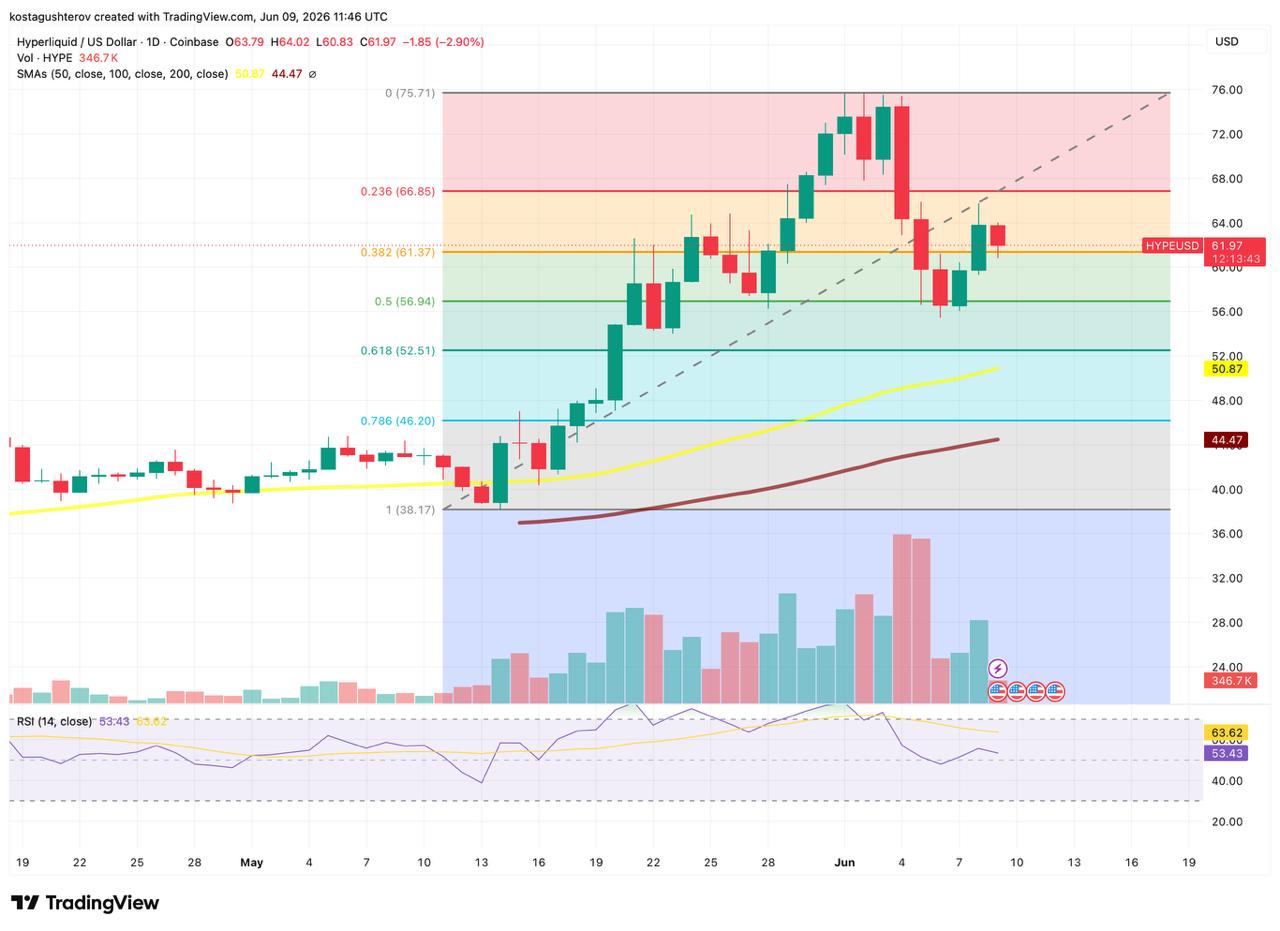
TradingView chart shows that the daily RSI has crossed below its signal line, indicating that short-term momentum currently favors the sellers. Because the RSI has not yet tapped oversold conditions, technical configurations suggest room for further near-term softness before a formal daily reversal signal prints.
- The Bullish Case: If $61.37 holds firmly into the daily close, HYPE could see a period of tight consolidation between $61 and $67, opening the door for a potential retest of the $66.85 resistance level.
- The Bearish Case: If $61.37 breaks cleanly, the next logical structural area to watch is the 0.5 retracement at $56.94. Below that, the 0.618 golden pocket at $52.51 converges closely with the rising 50-day Simple Moving Average (SMA) – creating a major confluence of historical support where the mid-May rally initially accelerated.
Because both the 50-day and 100-day SMAs are rising and tracking well below current price action, the macro bull market structure remains technically intact. However, the wide extension away from the 50-day SMA suggests that a healthy mean-reversion process could play out without violating the broader long-term thesis.
The Structural Tension
The immediate narrative surrounding HYPE highlights a clear tension between fundamental timescales and technical realities. Citrini’s thesis, anchored by fee-driven buybacks, structural burns, and steady ETF inflows, is a multi-month, fundamental story. Conversely, the daily chart is resolving a sharp, two-week corrective cycle following a near-vertical run.
These two realities are not mutually exclusive. A deeper technical flush toward the $51–$52 liquidity pocket could coexist with a structurally intact, long-term macro bull case. Today’s daily close relative to the $61.37 level serves as the market’s first real indicator of which short-term path clears the brush first.
The information provided in this article is for educational and research purposes only. Technical analysis, on-chain metrics, and institutional research summaries do not guarantee future price performance. Digital assets involve extreme volatility and risk. This content does not constitute financial or investment advice.

Alexander Zdravkov is a market analyst and crypto journalist with interests in economics, broader financial markets and digital assets. His journey into crypto began more than four years ago, driven by a fascination with the rapid evolution of blockchain technology and the transformative potential of decentralized finance. He began analyzing market cycles and identifying emerging trends before they reach the mainstream. He holds a degree in International Relations - a background that helped shape his broader perspective on global economics, geopolitics, and the interconnected nature of modern financial markets. Whether covering the latest developments in the crypto sector or exploring broader macroeconomic themes, Alexander focuses on giving readers context rather than simply repeating headlines. During his career, he has authored more than 5,000 articles covering cryptocurrencies, traditional finance, and global market developments. His work spans everything from Bitcoin and altcoins to macroeconomic trends influencing risk assets worldwide.