Ethereum Tests Key Support From 2023: Three Signals to Watch

Three independent signals at the same Ethereum price zone - the weekly candle close might decide which one wins.
Key Takeaways
- Exchange reserves hit their lowest dataset reading as withdrawals accelerate.
- This is the third test of $1,600 support since 2023.
- TD Sequential 9-count printed directly inside the key support zone.
- Weekly volume hit its highest reading in the entire chart period.
Ethereum printed a weekly low of $1,505 before recovering to $1,631 at time of writing, a 4.5% intraday gain that brings price back above the $1,600 level. The weekly candle opened at $2,004 and peaked at $2,018 before the week’s selling took hold, producing an 18.58% weekly decline.
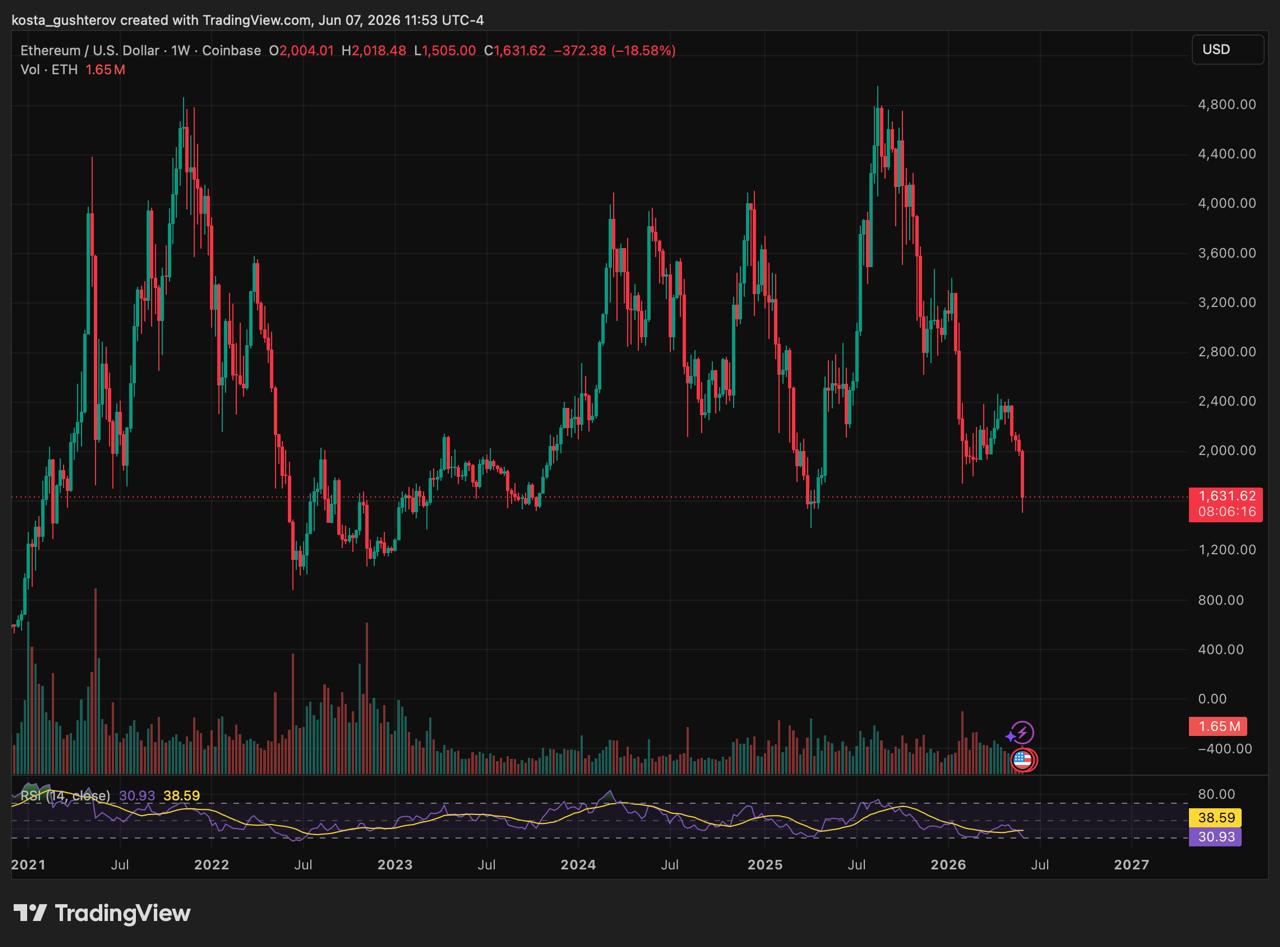
When tracking Ethereum’s multi-year macro structure, our analysis shows that the $1,600 baseline has consistently served as a key inflection point. It stopped the decline in mid-2023 before the recovery toward $4,800 in 2025, and held again during the April 2025 correction. The current test is the third time this level has been contested as support since 2023.
To understand why this level matters, it helps to know how price memory works. Every time a price level produces a significant reversal, the traders who bought there remember it. When price returns, many of those same participants treat it as a reference point to act on again. Buyers who missed prior bounces see it as a second chance. The more times a level holds, the more participants have it marked, and the more significant the next test becomes. For Ethereum at $1,600, two prior bounces from this zone mean a large portion of active market participants are watching this level closely right now.
When examining the weekly RSI at 30.93 with the signal line at 38.59, the reading sits near oversold territory last seen at confirmed cycle lows. The volume spike to 1.65M ETH for the current weekly candle is the largest single-week volume reading visible on the chart, consistent with heavy selling at a support level being partially absorbed by buyers.
TD Sequential Buy Signal on the 3-Day Chart
Crypto analyst Ali Charts wrote on X that according to him the TD Sequential indicator flashed a buy signal on Ethereum’s 3-day chart. “The TD Sequential just flashed a buy signal on Ethereum,” Ali Charts wrote, sharing a chart showing a completed 9-count with an upward arrow at approximately $1,612.
Rebound incoming!? 👀
The TD Sequential just flashed a buy signal on Ethereum $ETH. https://t.co/LNkygeXO5n pic.twitter.com/m0PBumtcbc
— Ali Charts (@alicharts) June 7, 2026
The TD Sequential is a momentum exhaustion indicator. A 9-count buy signal does not predict the direction of the next move. It signals that the current downward momentum has run for a statistically significant number of consecutive periods and may be cooling off. On the 3-day chart, each count represents three days of consecutive closes in the same direction, giving the signal more weight than the same reading on shorter timeframes.
What makes this signal worth noting is where it printed, directly within the $1,600 support zone that has held across two prior cycle phases. A momentum exhaustion signal at a historically significant price level carries more weight than either reading would produce on its own.
Exchange Reserves: Selling Pressure Subsiding
When analyzing CryptoQuant’s Ethereum Exchange Reserve data across all centralized exchanges, reserves have fallen to 14.6M ETH, the lowest level in the entire dataset, continuing a downward trend from approximately 21M ETH in mid-2025.
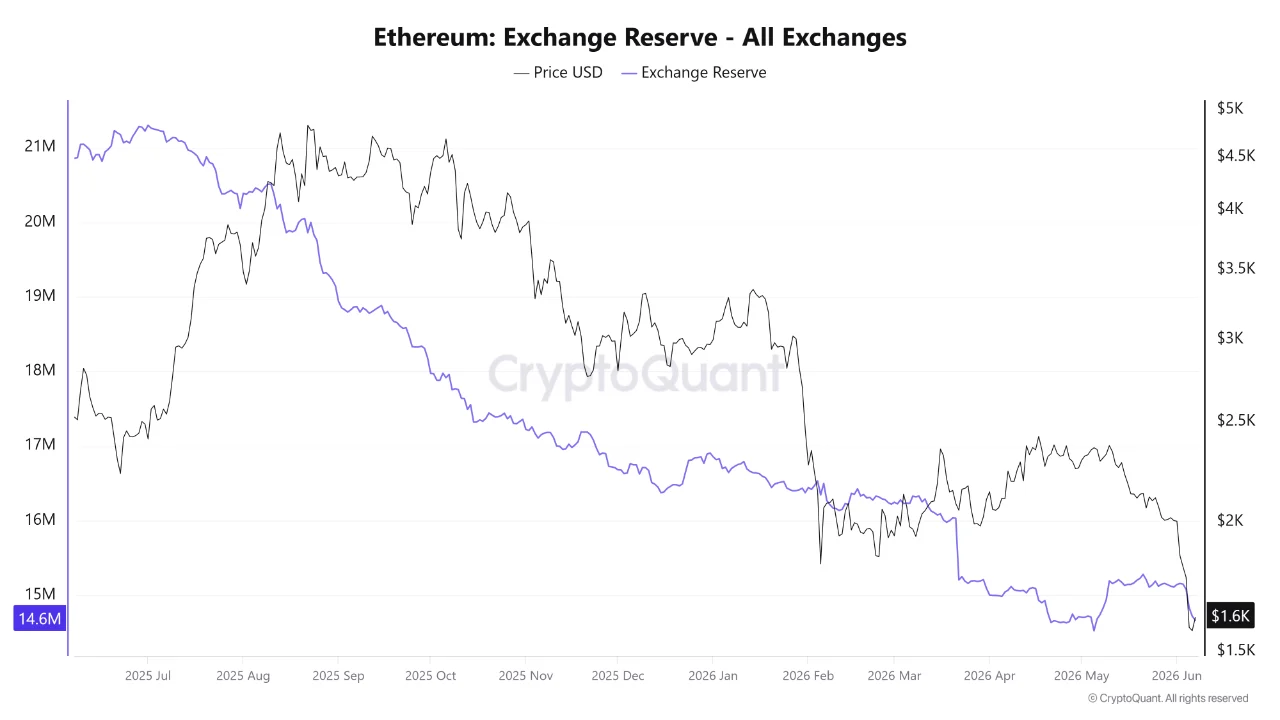
A short-lived rise in reserves occurred when retail investors moved coins to exchanges to reposition their portfolios. That move has since reversed, with reserves resuming their decline. The ongoing outflow indicates holders are withdrawing assets to personal wallets for storage rather than positioning to sell at current levels.
The practical implication is direct. With fewer ETH sitting on exchange order books, the same level of buy pressure produces larger price moves than it would in a higher-reserve environment. If genuine demand returns at current levels, the low reserve backdrop means the market could react more sharply to the upside than historical patterns would suggest.
What Needs to Hold
At $1,631, Ethereum sits on a support level that has held twice before, with technical, on-chain, and momentum data all pointing toward stabilization rather than continuation of the decline. The TD Sequential buy on the 3-day chart, the lowest exchange reserves in the dataset, and a weekly RSI approaching oversold territory are all aligned at the same price zone.
The weekly candle has not yet closed. A close above $1,600 keeps the support intact and registers the $1,505 low as a wick. A close below $1,600 removes the structural reference that anchored two prior recoveries and shifts the next confirmed support to the $1,400 to $1,500 zone. Until Sunday’s close, everything the data is signaling remains an argument in progress rather than a confirmed outcome.
The information provided in this article is for educational purposes only and does not constitute financial, investment, or trading advice. Coindoo.com does not endorse or recommend any specific investment strategy or cryptocurrency. Always conduct your own research and consult with a licensed financial advisor before making any investment decisions.

Alexander Zdravkov is a market analyst and crypto journalist with interests in economics, broader financial markets and digital assets. His journey into crypto began more than four years ago, driven by a fascination with the rapid evolution of blockchain technology and the transformative potential of decentralized finance. He began analyzing market cycles and identifying emerging trends before they reach the mainstream. He holds a degree in International Relations - a background that helped shape his broader perspective on global economics, geopolitics, and the interconnected nature of modern financial markets. Whether covering the latest developments in the crypto sector or exploring broader macroeconomic themes, Alexander focuses on giving readers context rather than simply repeating headlines. During his career, he has authored more than 5,000 articles covering cryptocurrencies, traditional finance, and global market developments. His work spans everything from Bitcoin and altcoins to macroeconomic trends influencing risk assets worldwide.