Chainlink Price Up 4% After Five Red Days – Turn or Pause?

Chainlink is trading at $9.26 with under five hours left in a daily session that opened on the 0.786 retracement, dipped to $8.62 and then turned higher.
Key Takeaways
- LINK at $9.26, up 4.22% on the day
- Price sits below the 50, 100, 200-day SMAs
- 0.786 Fib near $8.89 is tonight’s close test
- Demand box $7-$7.95 held three times in 2026
All figures come from the Binance LINK/USDT daily chart, read at 19:11 UTC on November 15 with the candle still open.
Three Averages, All Overhead
The quickest way to describe Chainlink’s November is by what it has lost. The 50-day SMA at $12.09 gave way first and is now curling down after the October highs. The 100-day at $11.6 went in the early-November leg. The 200-day at $10.11 was crossed in the last three sessions, during the steepest part of the drop. LINK now trades underneath every long-term trend filter on the daily chart.
That ordering matters. The nearest average, the 200-day, sits almost on top of the 0.618 retracement near $10.36, so the first serious resistance above the market is a cluster rather than a single line.
The 0.786 Is Doing the Work
The retracement grid runs from the $7.02 swing low to the $15.7 peak set at the turn of September into October. Every tier above the current price has already been broken: the 0.236 near $13.70 and 0.382 near $12.43 went with the distribution from the top, the 0.5 near $11.40 held for a brief early-November consolidation, and the 0.618 near $10.36 fell together with the 200-day SMA.
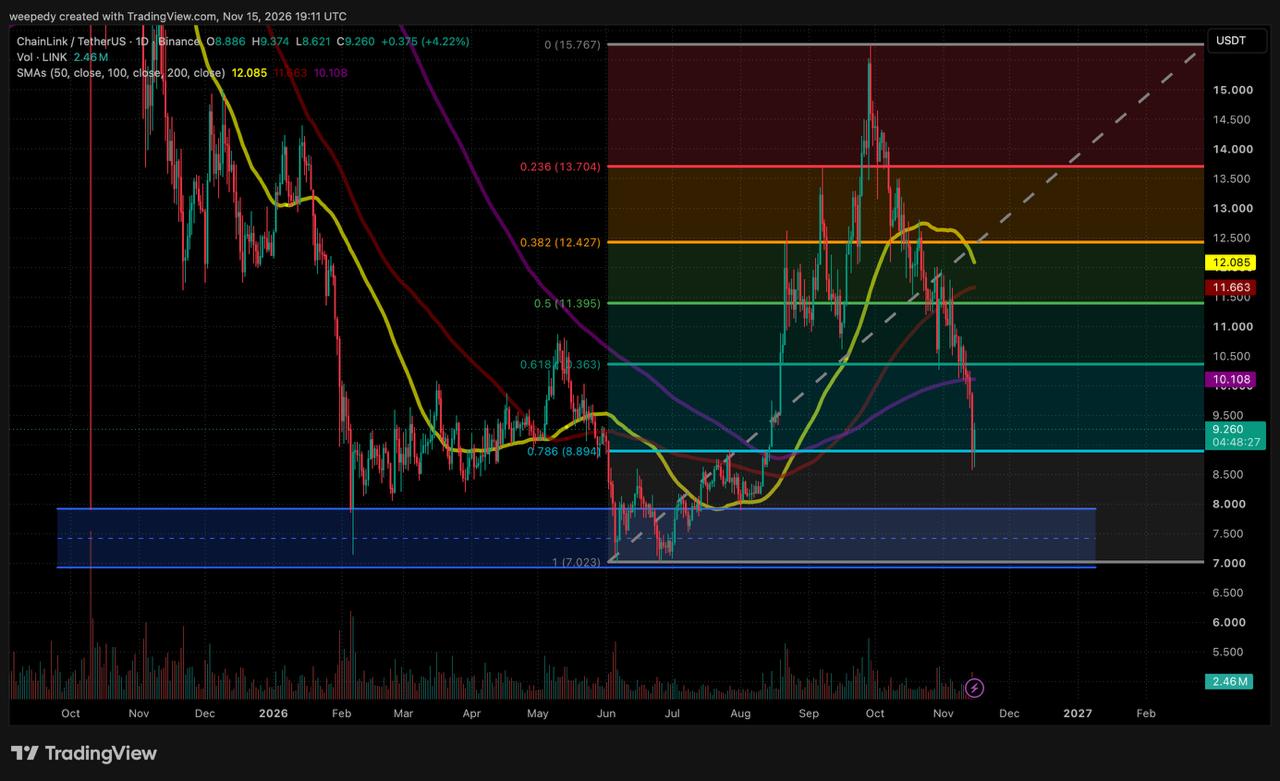
That leaves the 0.786, near $8.89, as the only Fibonacci level still in contact with price. Saturday’s candle closed at $8.89, effectively on the line. Sunday opened there, printed a low of $8.62 and then recovered to $9.26, a gain of $0.38 or 4.22%, with a session high of $9.37. Volume stands at 2.46M LINK, lighter than the red spike on Saturday’s drop.
The sweep did not reach the next support. Between $8.62 and the top of the demand zone at $7.95 there is still more than 7% of open space, so the buying that appeared today came in ahead of any obvious floor.
The Box Underneath
The blue zone on the chart between $7 and $7.95, with a midline near $7.45 and the 1.0 retracement at $7.02 along its base, is the structure that defines the bigger picture. It is the only area below the current price that has absorbed selling more than once this year, and the whole 2026 rally to $15.7 was built from inside it.
Capitulation wick into the box; close back above it the same session.
Breakdown from the spring range stopped inside the zone.
Multi-week double bottom; launch point of the run to $15.7.
Which Way the Week Can Go
Both cases start from the same candle and split on tonight’s close.
Reclaim scenario
The relief case rests on exhaustion: five heavy red candles from around $11.40 to $8.62, then a dip that was bought before it got anywhere near the box. If LINK closes today above $8.89 and follows through past $9.37 in the sessions ahead, the overhead target is the $10.11-$10.36 cluster where the 200-day SMA and the 0.618 retracement overlap. That zone is where a mean-reversion move would meet its first real test; nothing in the current structure argues for levels above it yet.
Rollover scenario
The case against the bounce is the trend it is bouncing inside. Price is under the 200-day average, today’s rebound volume is lighter than Saturday’s selling, and a market that retraces to the 0.786 after losing its 200-day line, with an untested demand zone sitting just below, is a setup traders commonly describe as a magnet for one more flush. A rejection at or before $10.11-$10.36, or a close back under $8.89 followed by a break of $8.62, would mark today as a pause rather than a turn and open a direct path into the $7.95-$7.02 box.
The longer view
Either way, the daily chart’s larger structure does not change tonight. A bounce to $10.36 would still leave LINK below two of its three moving averages and below the 0.5 retracement near $11.40. A drop into the box would bring price to the same floor that produced every major low this year; whether it holds a fourth time is the question that scenario poses, and the chart cannot answer it in advance.
Checklist Into the Close
- Close above $8.89: the 0.786 is reclaimed and Saturday’s close at $8.89 becomes the floor of the bounce.
- Close between $8.62 and $8.89: inconclusive; the level is neither reclaimed nor lost, and Monday decides.
- Close below $8.62: the sweep low fails on a closing basis, with no chart support until $7.95.
- Volume at the bell: a green bar that stays well below Saturday’s red spike weakens the reclaim reading even if the price level holds.
At $9.26, LINK is $0.37 above the level that matters and $1.31 short of the first resistance that would challenge the downtrend. The close in a few hours settles which of those distances the market works on next.


Alexander Zdravkov is a market analyst and crypto journalist with interests in economics, broader financial markets and digital assets. His journey into crypto began more than four years ago, driven by a fascination with the rapid evolution of blockchain technology and the transformative potential of decentralized finance. He began analyzing market cycles and identifying emerging trends before they reach the mainstream. He holds a degree in International Relations - a background that helped shape his broader perspective on global economics, geopolitics, and the interconnected nature of modern financial markets. Whether covering the latest developments in the crypto sector or exploring broader macroeconomic themes, Alexander focuses on giving readers context rather than simply repeating headlines. During his career, he has authored more than 5,000 articles covering cryptocurrencies, traditional finance, and global market developments. His work spans everything from Bitcoin and altcoins to macroeconomic trends influencing risk assets worldwide.