Zcash Price Sinks Under $900 on 8% Drop: Key Levels

Zcash is down almost 8% on Saturday after losing its 0.5 Fibonacci level and 100-day average this week, leaving the 200-day average as the last major support nearby.
Key Takeaways
On the Binance ZEC/USDT daily chart, the question is no longer which support breaks next. It is whether the one support that still stands, a moving average and a Fibonacci level stacked seven dollars apart, can absorb a market that has not printed a meaningful lower wick all week.
A candle with nothing underneath it
Saturday opened at $934. The high was $940. Everything after that was one direction: down to $859, and at the time of writing ZEC sits at $861, about two dollars above the low with more than seven hours to go. The bar is close to a marubozu, a candle with almost no wick on either end, and the lower end is the one that matters. No lower wick means no point in the session where buyers pushed back hard enough to leave a mark.
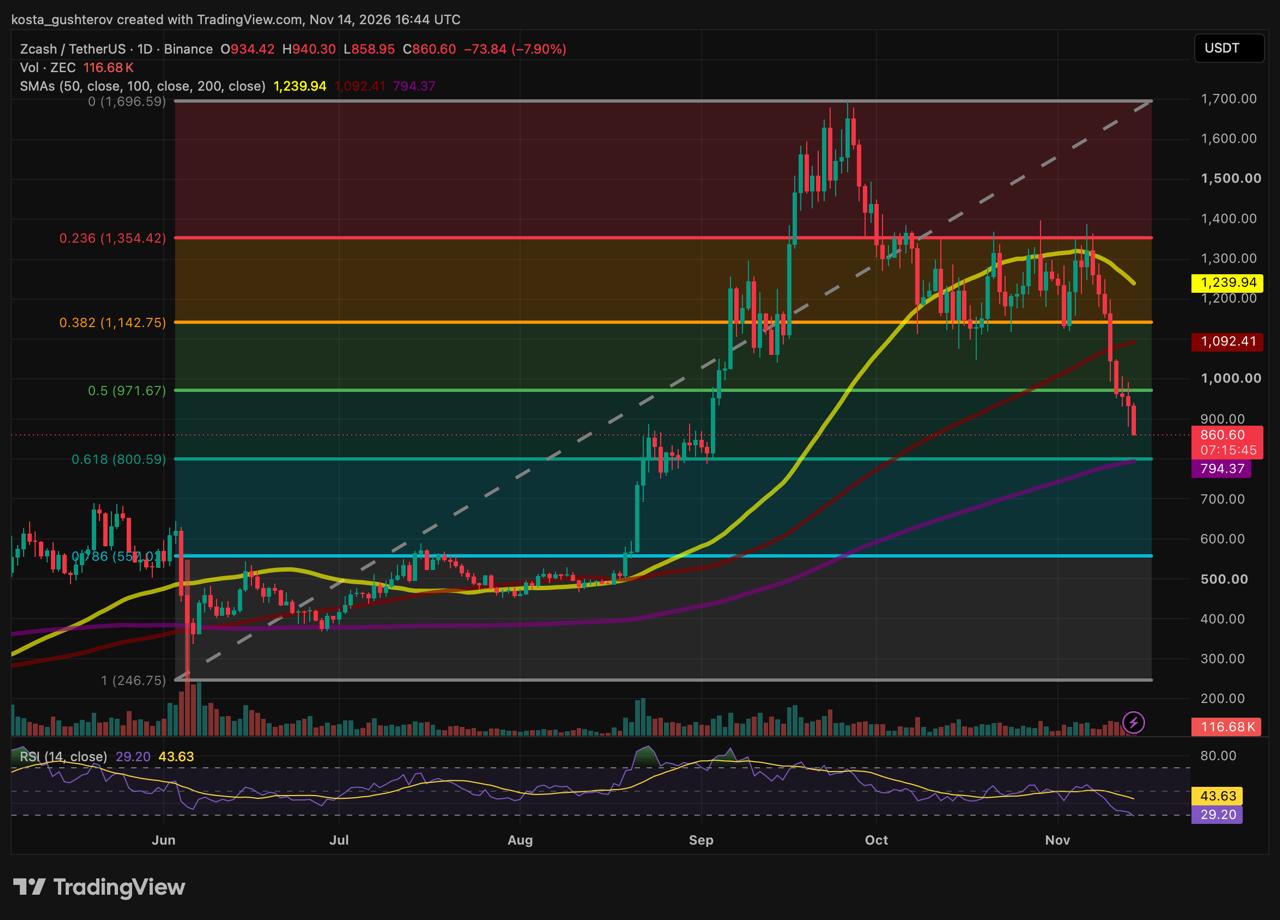
Volume is 116.68K ZEC. The RSI (14) has dropped to 29.2, its first trip under 30 since the June bottom, while its signal line is still up at 43.6. That fourteen-point spread is the momentum story in one number: the selling did not build gradually, it arrived.
Note what did not happen on the way down. The 0.5 Fibonacci level near $972 broke on Friday’s close; Saturday’s high of $940 stopped roughly $30 beneath it. Broken levels normally get at least one look from below before the market moves on. This one did not get a look at all. The same was true at the 0.382 near $1,143 and the 100-day SMA at $1,092 earlier in the week, a stretch Coindoo followed as the $1,000 handle gave way on a 14% drop.
Three measurements that agree on one price
Directly below the current price, three independent tools point at the same spot. The 0.618 retracement of the June-to-October rally, the golden pocket, sits near $801. The 200-day simple moving average, still rising, is at $794. And in late August, before the September breakout that eventually carried ZEC to $1,697, price spent several weeks consolidating in a band between roughly $800 and $850. Saturday’s low of $859 is already touching the top of that band.
Each of these is easy to dismiss alone. A Fibonacci ratio is geometry; a 200-day average is backward-looking by design; an old consolidation is just memory. Together, within seven dollars of each other, they describe the one place on the chart where a buyer with a long-term view, a trend follower and a short-term trader are all looking at the same number. That is what confluence means in practice, and ZEC is about $60 above it.
For completeness, the 50-day SMA is at $1,240, rolling over after it failed as support in early November. It sits nearly $380 above price and has no bearing on the next few sessions.
Everything might turn on a close below $794
Read Saturday’s candle literally and the $60 gap closes quickly: sellers who have met no resistance all week keep pushing until they hit the $794-$801 pocket, run whatever stops sit just under $800, and only then find out whether anyone is waiting. The RSI at 29.2 argues that the people doing the selling are close to exhausted; the shape of the candle argues they are not finished. Both can be true at once, and the pocket is where they get resolved.
If the pocket holds, whether on a bounce from the $859 shelf or after one last capitulation wick into $794–$801, the recovery has a short list of ceilings. The first is Saturday’s own $934–$940 range. The second is the broken 0.5 near $972, which switches from floor to lid, with the round $1,000 immediately behind it. The 100-day SMA at $1,092 is further up and belongs to a different conversation; an oversold bounce normally tests the first broken level, not the third.
If the pocket fails on a daily closing basis, the chart changes character. Below the 200-day average there is no Fibonacci level, no moving average and no consolidation shelf until the 0.786 retracement near $552, more than $240 lower. That is not a projection; it is a description of the empty space. The reason a close under $794 is the number that matters is simply that nothing on this chart would be left to catch price between there and the mid-$500s.
The reason to resist calling this a trend reversal before that close happens is just as plain. A move from $247 to $1,697 and back to its 0.618 is, by definition, still a retracement; the uptrend’s own moving average has not been breached. Weekend order books also tend to be thinner, which can stretch a candle in either direction without telling you much about Monday. The chart will give its answer at $794, and the honest position until then is that it has not given one yet.
Disclaimer: This article is a technical analysis of the Zcash price based on a single daily chart and is provided for information purposes only. It is not investment advice, a recommendation to buy or sell any asset, or a prediction of future price movements. Fibonacci levels, moving averages and the scenarios described are tools for framing possible outcomes, not guarantees. Cryptocurrency markets are volatile and you can lose some or all of your capital. Do your own research and consult a licensed financial adviser before making any trading decision.



Kosta has reported on cryptocurrency markets and blockchain infrastructure since 2020, bringing over six years of hands-on experience in the crypto industry built through daily tracking of markets, trends, and emerging blockchain developments. Specializing in Bitcoin on-chain analysis, institutional ETF flows, and digital asset price action, his work at Coindoo has been cited by other news agencies and consistently covers market developments with a focus on data-driven reporting across Bitcoin, Ethereum, Solana, and XRP. Over the years, Kosta has contributed to multiple crypto media outlets in different regions, authoring over 6,000 articles across the sector. His reporting spans cryptocurrency markets and the broader fintech industry, tracking not only price action but also the technological and regulatory forces shaping the ecosystem. To support his analysis, Kosta actively leverages on-chain data and metrics from leading platforms such as Santiment, Glassnode, and CryptoQuant, enabling deeper, evidence-based market insights. He believes in the power of transparency and the data that underpins the blockchain ecosystem. His academic background in Marketing Management from Denmark further complements his analytical approach, adding a strong understanding of communication strategy and content positioning to his work.