HYPE Price Dips to $70 Where Weekly and Daily Charts Meet

HYPE is trading at $70 with the weekly candle sitting on the floor of its year-long rising channel and the daily candle on the 0.618 retracement of the August-to-October rally.
Key Takeaways
- Weekly low $67 wicked under the channel floor
- Daily 0.618 near $70 holding so far
- Weekly RSI 49, first sub-50 since Q1
- Daily RSI 33, above oversold
The two timeframes are telling the same story from different distances. The weekly chart shows a pullback inside an uptrend that has run since January; the daily shows a steep correction that has eaten three Fibonacci levels in two weeks. Both have brought price to the same number, which is why the next two closes carry more weight than the last ten.
The weekly chart: Back at the rail that started everything
HYPE bottomed near $22 in January 2026 and has traded inside a rising parallel channel on the Binance.US weekly chart ever since. The lower rail has been the trend’s engine: price rode it from January through May, came back to it in the mid-July pullback near $52 and launched again. The upper rail, together with the $100 handle, turned price away in September and once more in early November.
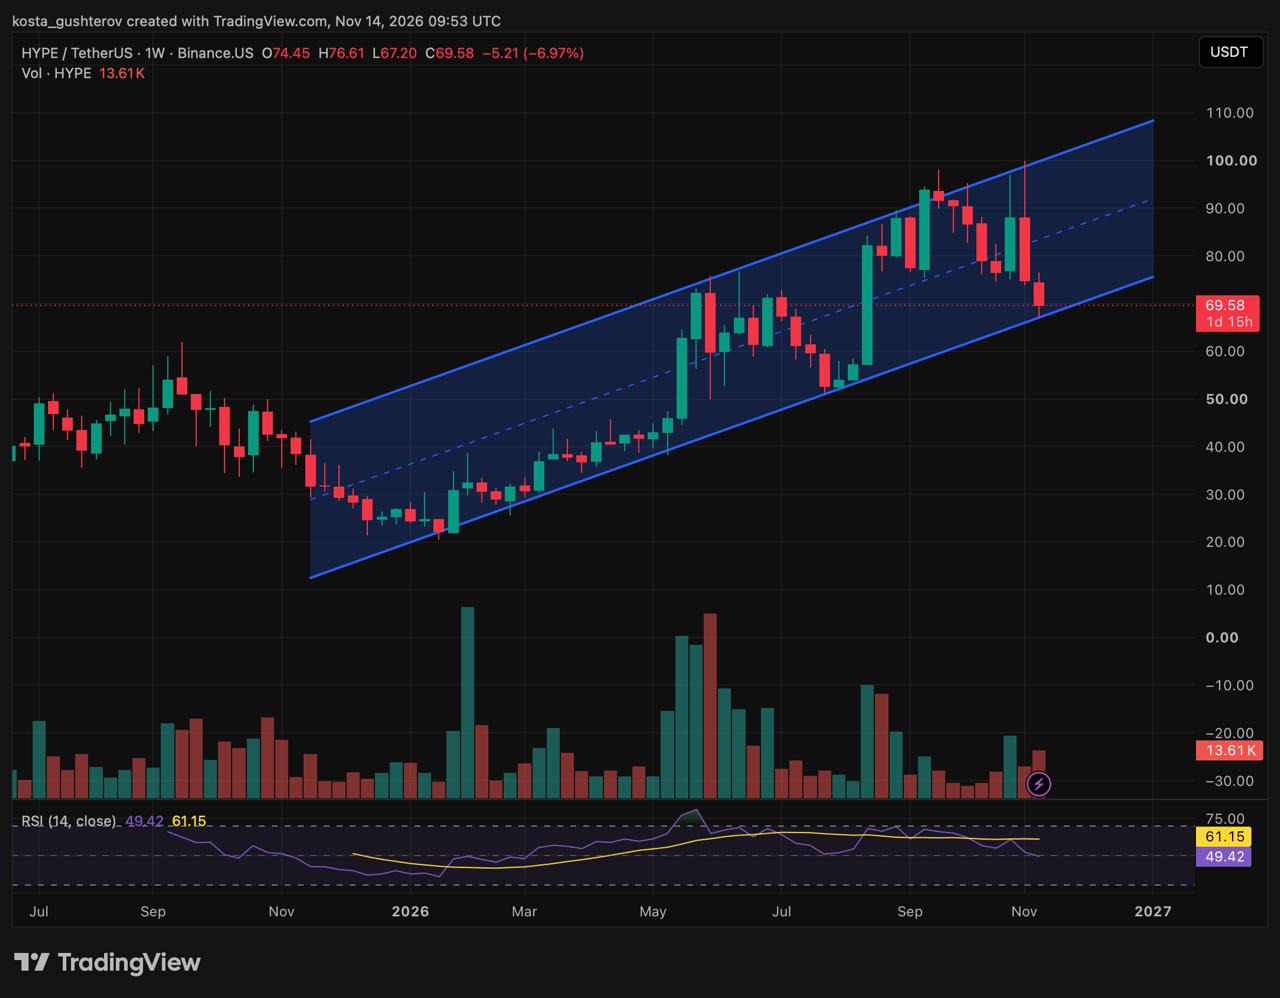
This week’s candle is the first return to the lower rail since July. It opened at $74, reached $77 and printed a low of $67, which pokes through the trendline, before recovering to $70, where the body is resting on the line with a day and fifteen hours left before Sunday’s close. The weekly RSI (14) has come down from above 75 in May and June to 49.42, under its signal line at 61.15 and below the 50 midpoint for the first time since the first quarter. On this timeframe the uptrend is intact and being tested, not broken.
The daily chart: Three levels lost, one left
Measured from the $51 August low to the $100 October peak, the daily Fibonacci grid gives the correction a sequence. The 0.236 near $88 went in the early-November breakdown. The 0.382 near $81 was the level price pivoted around in late October before the final push to $100. The 0.5 near $75 broke this week. That leaves the 0.618 near $70, and today’s candle, after opening at $72 and dipping to $67, is trading right on it.
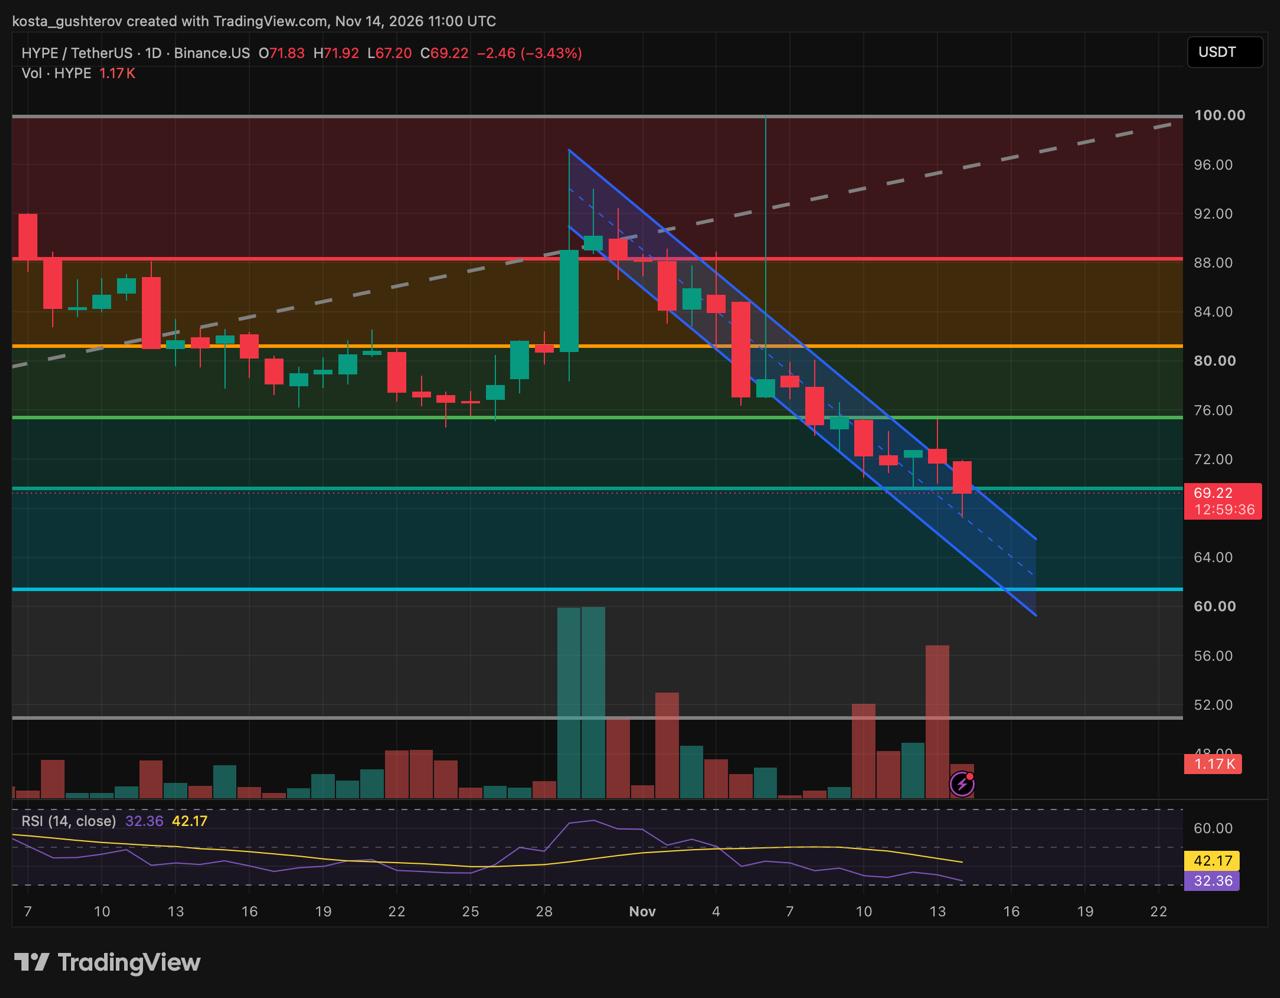
The decline from the early-November lower high near $97 has run inside a tight descending channel, and today’s candle is pressing against that channel’s upper trendline at the same time as it holds the 0.618. The daily RSI is at 32.79, below its 42.20 average and a few points above the oversold line. Daily volume on this venue is 1.13K HYPE, and the weekly bar 13.61K; Binance.US is a small pool for this pair, so the price levels transfer to the wider market but the volume bars should be read as local.
Where the lines cross
Three things sit inside a few cents of $70: the lower boundary of the weekly rising channel, the daily 0.618 retracement, and the upper trendline of the daily descending channel. Buyers have already defended the area once, leaving a lower wick to $67 on both timeframes. The daily RSI leaves sellers little room before an oversold reading, while the weekly RSI has reset from overbought to neutral. That combination is as dense a support cluster as this chart has produced in 2026, and it is also the first place where losing a level would change the shape of the year-long trend rather than just the shape of November.
The next forty hours, close by close
Tonight’s daily close is the first checkpoint, and it asks one question: does HYPE finish above the 0.618 near $70 or below it? Above, and the candle has defended the retracement and the lower wick to $67 stands as a rejection. The stronger version of that answer is a close back over today’s open at $72, because that is where the upper trendline of the descending channel runs; a close there takes price out of the channel and ends the daily downtrend as a structure. Below $70, and the last Fibonacci level of the grid has gone the way of the three above it.
Sunday’s weekly close is the second checkpoint, and it is the one that reaches further back. The rising channel has caught every weekly close since January, so a finish at or above the rail near $70 keeps the trend’s definition unchanged, whatever the daily chart did on Saturday. A weekly close under $70 is different in kind: it would be the first time in ten months the trend’s own boundary failed to hold, and it would land with the weekly RSI already under 50 for the first time since the first quarter.
Put the two together and there are only a few combinations. Daily above $72 and weekly above $70 is the cleanest recovery case, and the path it opens runs back up the grid: the 0.5 near $75, then the 0.382 near $81, then the weekly channel midline around $85 to $88 as the first higher-timeframe level a rebound would have to earn. Daily above $70 but weekly under it is a split verdict, a bounce on the short chart that has not repaired the long one. Both under $70 is the breakdown, and a close beneath the $67 swing low would confirm the loss of the channel floor and the 0.618 together; the daily grid’s remaining references below are the 0.786 around $61 and the $51 origin of the August rally.
The backdrop does not help the first combination. Bitcoin is near $67,000 Ethereum around $1,850 and XRP near $1, all of them still falling, and a support cluster that would normally absorb a single-coin correction has to absorb the whole market’s selling at once. Even on the recovery path, a bounce that stalls under the 0.5 near $75 leaves the daily channel in place and the weekly test unanswered. None of this is a forecast. It is a reading of which close answers which question, and until Sunday night the weekly chart’s verdict and the daily chart’s verdict are both still pending.
This article is for informational purposes only and is not financial or investment advice. The levels and scenarios described are based on technical analysis of public chart data and do not guarantee future price movements. Cryptocurrencies are volatile, so do your own research before making any trading or investment decision.



Alex is Editor-in-Chief of Coindoo and co-founder of Millennial Media Group, with nearly a decade of experience covering financial markets - crypto first, then everything else. It started in 2016 with Bitcoin. Like most people at the time, he didn't fully understand it - so he kept digging. Blockchain, tokenomics, the projects, the cycles. That curiosity never stopped, and eventually pulled him into traditional markets too: equities, commodities, macro. Not because he left crypto behind, but because you can't properly understand one without the other. What drives him is straightforward: he wants to know why something is happening, not just that it's happening. Most market coverage stops at the headline - price up, price down, here's a chart. Alex finds that kind of reporting actively unhelpful. If you walk away from an article without understanding the mechanism behind the move, what did you actually learn? He holds a degree in Tourism from New Bulgarian University - not the most obvious path into financial markets, but markets have a way of pulling in people who are simply too curious to stay out. He has authored over 200 in-depth analyses and more than 10,000 articles across crypto and traditional finance. He still thinks every day in markets teaches him something new. That's probably why he hasn't stopped.