Bitcoin Price Dips Under $69K: 200-Day Now 6% Overhead

Bitcoin dropped almost 4% overnight to $68,633, trading below the 0.618 retracement near $69,056 for the first time since August and 6% under the 200-day average it lost this week.
Key Takeaways
Coindoo’s Tuesday analysis marked a daily close under the 0.500 Fibonacci around $72,561 as the point where the 200-day would be surrendered; Thursday closed at $71,460. The readings below are from the Binance daily chart at 05:47 UTC on Friday, with just over 18 hours left in the session.
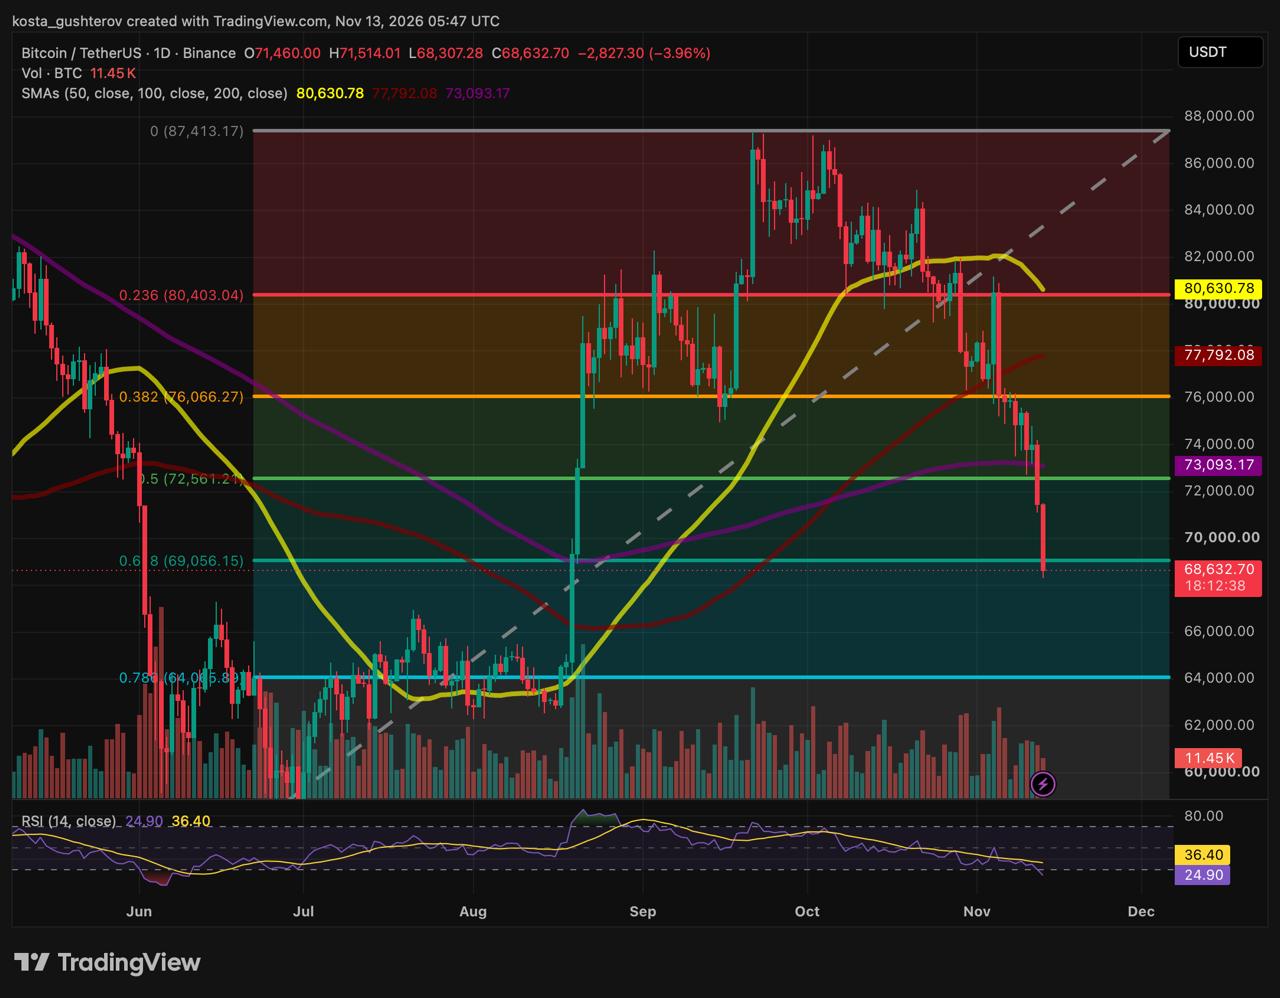
Three sessions, three floors
The sequence has been fast. On Tuesday Bitcoin was testing its 200-day average from above for the first time since September. On Thursday it closed below it. By Friday morning it had dropped through the next retracement level as well and was trading closer to the 0.786 than to the average it had just lost.
Under $74,000 after the October CPI print. First test of the 200-day since September.
Under $72,000 in the hour after Nvidia announced Jensen Huang’s resignation. Daily close at $71,460, below the 0.500 and the 200-day.
Low of $68,307 before 06:00 UTC. Under the 0.618 for the first time since August.
Friday’s candle opened at $71,460, managed a high of $71,514 and then fell $3,200 to its low in a straight line. Volume by 05:47 UTC was 11.45K BTC, an early figure that says more about the hours to come than the ones already traded.
Back inside the August candle
The retracement grid runs from the summer low near $60,000 to the October peak near $87,413. The level that just gave way, the 0.618 near $69,056, sits in the middle of the late-August breakout candle that lifted Bitcoin out of a two-month range between roughly $62,000 and $66,000 in a single session. The 0.786 near $64,036 is the base of that candle and the top of the old range.
That is why $69,000 mattered more than its 0.618 label suggests. Above it, the decline was a retracement of the autumn rally. Below it, Bitcoin is back inside the move that started the rally, and the next horizontal level is the range it left in August. From $68,633, the 0.786 is about 6.7% lower; the summer low is about 12.6% lower.
Three averages, all above, all a long way off
The 200-day at $73,093 is the nearest, about 6.5% overhead, and it is the one that changed the trend reading when Thursday closed beneath it. The 100-day at $77,792 is 13% away. The 50-day at $80,631 has started to roll over and sits just above the 0.236 near $80,403, 17.5% above the current price. Every average that defined the uptrend is now a ceiling, and the closest of them is further from price than the next support below.
RSI at 24.90 cuts both ways
The 14-day relative strength index (RSI) reads 24.90, well under the 30 line that signals oversold conditions and more than 11 points below its signal line at 36.40. The last time it was this low was the June selloff, which ended with a sharp reversal from a low near $60,000.
The reading of that could be two-sided. An RSI under 25 with price sitting on a Fibonacci level is the setup in which relief bounces usually appear, and Tuesday’s analysis said as much about the 0.500. But that bounce never came; the 0.500 broke instead, and so did the 0.618 two sessions later. In a decline this impulsive, oversold readings describe how hard the selling has been, not when it stops. The June comparison is a reminder that bottoms can form from here. It is not evidence that one has.
Two paths from $69,000
Both begin with whether the $68,000 to $69,000 area holds on a daily closing basis.
Relief first
If Friday closes back above the 0.618 near $69,056, with the $68,307 low intact, the oversold reading and the level together could support a counter-trend bounce. The first targets would be the 0.500 around $72,561 and the 200-day at $73,093, roughly 5.7% to 6.5% higher. A move into that zone on falling volume, followed by a rejection, would keep the trend reading bearish; only a reclaim of the 200-day on a daily close, with volume behind it, would change it.
Continuation
A daily close under $68,000 would confirm the 0.618 as broken and leave the 0.786 near $64,036 as the next reference, about 6.7% below. That level is also the roof of the July and August range, so a test there would be a test of whether buyers who held Bitcoin at those prices through the summer still want it. Below that, the grid ends at the summer low near $60,000.
What Friday’s close decides
The 0.618 was broken before European trading opened, which leaves most of the session to decide whether the break sticks. A close above $69,056 would turn Friday into a wick below support with an RSI near 25 under it, the shape that has started bounces before. A close under $68,307 would make the overnight low the new ceiling for Saturday and put the 0.786 on the table within a single session’s range. Either way, the 200-day is the first level that would have to be recovered for any of this to count as more than a pause.
This article is for informational purposes only and is not financial or investment advice. The levels and scenarios described are based on technical analysis of public chart data and do not guarantee future price movements. Cryptocurrencies are volatile, so do your own research before making any trading or investment decision.



Kosta has reported on cryptocurrency markets and blockchain infrastructure since 2020, bringing over six years of hands-on experience in the crypto industry built through daily tracking of markets, trends, and emerging blockchain developments. Specializing in Bitcoin on-chain analysis, institutional ETF flows, and digital asset price action, his work at Coindoo has been cited by other news agencies and consistently covers market developments with a focus on data-driven reporting across Bitcoin, Ethereum, Solana, and XRP. Over the years, Kosta has contributed to multiple crypto media outlets in different regions, authoring over 6,000 articles across the sector. His reporting spans cryptocurrency markets and the broader fintech industry, tracking not only price action but also the technological and regulatory forces shaping the ecosystem. To support his analysis, Kosta actively leverages on-chain data and metrics from leading platforms such as Santiment, Glassnode, and CryptoQuant, enabling deeper, evidence-based market insights. He believes in the power of transparency and the data that underpins the blockchain ecosystem. His academic background in Marketing Management from Denmark further complements his analytical approach, adding a strong understanding of communication strategy and content positioning to his work.