Bitcoin Price Jumps Off Important Fib Level as US PPI Slows

Bitcoin’s slide paused at a widely watched Fibonacci level, and a wholesale inflation print that undershot forecasts by a tenth of a point gave the bounce its first tailwind.
Key Takeaways
- Bounce held near $69,062, the 0.618 retracement
- Monthly PPI softer, annual rate still rising
- Four-hour RSI dipped under 30
- All three 4-hour SMAs sit overhead
The Bureau of Labor Statistics reported a 0.3% monthly rise in final-demand producer prices for October against a 0.4% consensus, and the first four-hour candle after the release is up close to 0.9% from its open.
The wick went under $69,000. The close did not.
On the Binance 4-hour chart, Friday’s selloff ran straight through the 0.5 retracement around $72,569 and stopped at the 0.618 near $69,062. Price spiked below $69,000 intrabar and closed the candle back above the level. At the time of writing Bitcoin traded around $69,900, with the current candle ranging between $69,068 and $70,214.
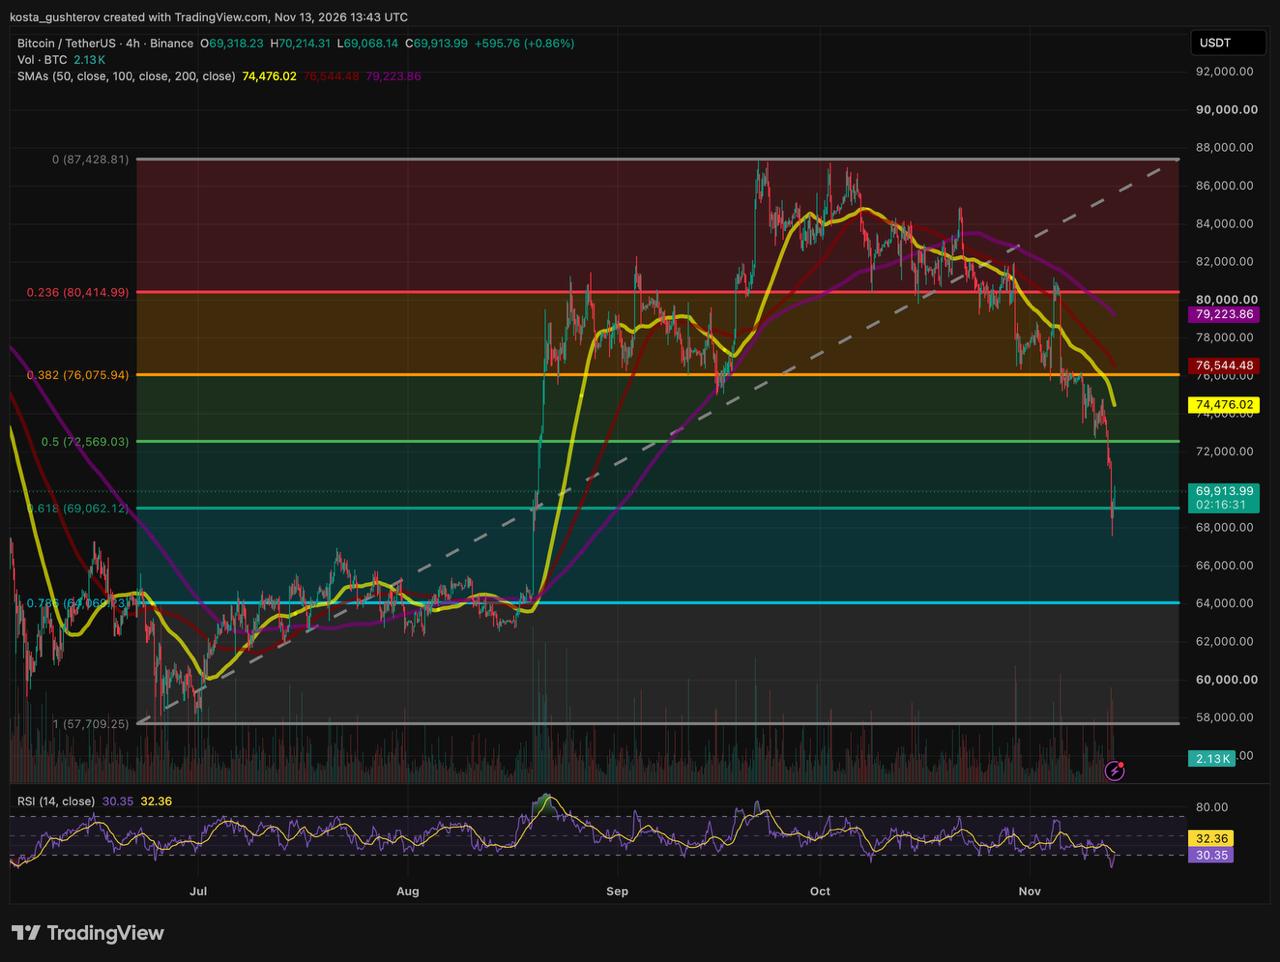
A wick through a level and a close back above it is the chart’s version of buyers stepping in at a predefined price. Two details temper it. The breakdown candles carried the heaviest volume since the November 5 drop, while the four-hour bounce candle has so far printed on lighter volume, 2.13K BTC against the red bars beside it. And one four-hour close above a level is a defence, not a reclaim; the pattern earns more weight if the next few candles keep their lows above $69,062.
Momentum is the cleaner part of the picture. The 14-period RSI fell to 29.96, below the 30 line that marks oversold on this timeframe, with its signal average at 32.33. A first bounce from a reading that low is common; the indicator gives no guide to the size of it.
Minute by minute into the release
The 15-minute chart shows the order of events. Bitcoin printed its low shortly after 05:00 UTC on the heaviest selling of the night, worked back above $69,000 by around 11:00 UTC and spent the next two and a half hours in a tight band between roughly $69,100 and $69,400, with volume thinning candle by candle. The level had held on its own merits for more than two hours before the data arrived; the PPI did not rescue the 0.618.
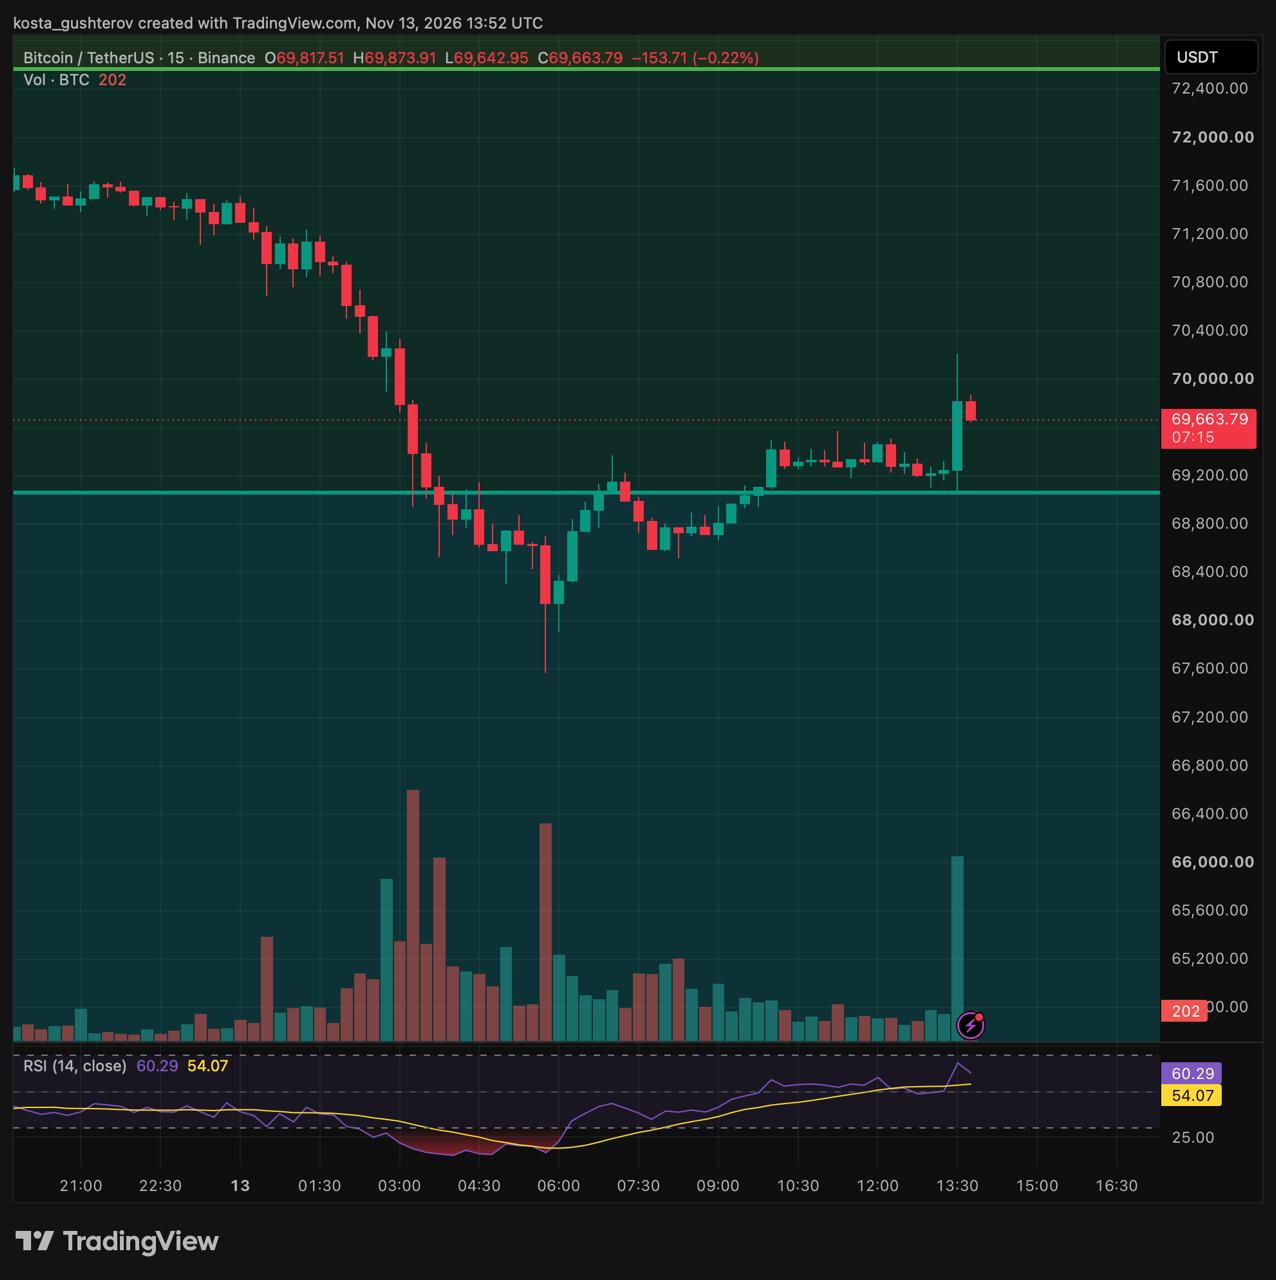
When the 13:30 UTC candle opened on the data, price jumped to about $70,200 on the largest single volume bar of the session, larger than the capitulation bar at the morning low, then gave back the top of the move and settled near $69,800 within the same fifteen minutes. The 15-minute RSI jumped from the mid-50s to about 64 on that bar, its highest reading of the day. The print added fuel to a bounce already underway, and the speed with which $70,000 was sold marks the round number as the nearest overhead reference.
PPI: softer than feared, not soft
Source: US Bureau of Labor Statistics, October 2026 Producer Price Index, released November 13. Consensus figures as compiled by Dow Jones and reported by CNBC.
The relief in this report is all in the monthly column. After September’s 1.4% jump, a 0.3% October reading is a sharp deceleration, and it landed a tenth under what economists had pencilled in. Everything else points the other way. The annual rate climbed again and now sits at its highest since November 2022. The core measure that strips out foods, energy and trade services ran at 0.5% for a second month. Goods inflation over twelve months is in double digits, and the services increase was driven by a 3.9% jump in freight trucking, the kind of cost that passes through to consumer prices with a lag.
Why a softer producer-price number helps Bitcoin
Bitcoin pays no yield, so it competes with cash and Treasuries on expected returns. When markets price a larger or longer run of rate increases, the dollar strengthens and the opportunity cost of holding a non-yielding asset rises; that combination was behind Friday morning’s drop below $70,000, when the dollar rallied on December hike expectations. CNBC report futures fully pricing a quarter-point increase at the December 8-9 meeting with a small probability of a half-point move. A PPI reading that comes in under forecast could nudge that pricing the other way: it might lower the odds of the larger move, which can eases pressure on the dollar and on short-term yields, and risk assets might get a reflexive bid. That is the possible channel at work in the 13:30 UTC candle.
It is also the limit of the good news. The October CPI had already come in hotter than forecast on Tuesday, so Friday’s number was the first inflation print of the week that did not add to the case for a bigger hike, and that is all it was. It did nothing to remove the quarter-point move markets expect, and its annual figures argue for further tightening, not less. The tailwind is a smaller hike, not an easier Fed.
What sits between here and the moving averages
The bounce has a lot of chart above it. All three simple moving averages on the four-hour timeframe are overhead and sloping down, and the ascending trendline that connected the July low to the August and September pullbacks broke during the November 5 leg, so it no longer offers support from below. The daily picture is covered in Coindoo’s note on the 200-day average moving overhead.
Reading the ladder top-down, the first real test is the 0.5 retracement, which was support on the way down and is the first place where holders trapped above it could exit at break-even. The 50-period average and the 0.382 level sit close together above that, forming the band where the November 7 to 12 consolidation played out. Nothing in the structure changes character until price is back above the 200-period average; below it, a rally is a bounce inside a downtrend by definition.
Macro dates on the calendar
The PPI was the last inflation print before a run of releases that feed directly into the December Fed decision. Each lands on a market already leaning toward a hike, so the asymmetry runs one way: an in-line number changes little, a hot one reopens the half-point debate.
Three of those carry more weight for Bitcoin than the others. The October 28 minutes will show how many officials argued for a larger move and why. PCE on November 25 is the inflation measure the Fed targets, and economists build their estimate of it from the CPI and PPI components; the freight and services figures in Friday’s PPI feed that calculation. The December 9 meeting is the only one this quarter with a new set of projections, so the rate path for 2027 gets redrawn that afternoon.
Until then, the chart has given a clear reference. Holding $69,062 on a closing basis keeps the Fibonacci defence intact and the 0.5 level as the test that matters. Losing it hands the initiative back to sellers, with the next reference more than 8% lower.
Chart data: Binance BTC/USDT, 4-hour timeframe, snapshot November 13, 2026, 13:43 UTC; 15-minute timeframe, snapshot 13:52 UTC. Fibonacci levels measured from the $57,709 low to the $87,429 high. Moving averages are simple, 50-, 100- and 200-period on the 4-hour chart. Percentage distances are calculated from approximately $69,900 and rounded to one decimal.
Disclaimer
This article is market analysis, not investment advice. The levels and scenarios described are ways of reading current chart and macro data, not forecasts, and no price move is predicted. Cryptocurrency markets are volatile and leveraged positions can be liquidated quickly. Conduct your own research and consult a licensed financial adviser before making any investment decision. Coindoo and the author accept no responsibility for losses arising from decisions based on this content.



Kosta has reported on cryptocurrency markets and blockchain infrastructure since 2020, bringing over six years of hands-on experience in the crypto industry built through daily tracking of markets, trends, and emerging blockchain developments. Specializing in Bitcoin on-chain analysis, institutional ETF flows, and digital asset price action, his work at Coindoo has been cited by other news agencies and consistently covers market developments with a focus on data-driven reporting across Bitcoin, Ethereum, Solana, and XRP. Over the years, Kosta has contributed to multiple crypto media outlets in different regions, authoring over 6,000 articles across the sector. His reporting spans cryptocurrency markets and the broader fintech industry, tracking not only price action but also the technological and regulatory forces shaping the ecosystem. To support his analysis, Kosta actively leverages on-chain data and metrics from leading platforms such as Santiment, Glassnode, and CryptoQuant, enabling deeper, evidence-based market insights. He believes in the power of transparency and the data that underpins the blockchain ecosystem. His academic background in Marketing Management from Denmark further complements his analytical approach, adding a strong understanding of communication strategy and content positioning to his work.