Bitcoin Falls Under $76,000 After 50 MA Rejection Triggers $212M in Liquidations

Bitcoin is trading at $75,834 on the 1H chart as of May 22, with all three moving averages declining above current price and an RSI reading of 24.67 placing the hourly momentum in deeply oversold territory.
- BTC trading at $75,834, down 1.5% in the past hour, below 100 MA at $77,213
- 50 MA break and reversal on 1H: bull trap at $77,443 now liquidating long positions
- 1H liquidations: $209.41M long vs $3.54M short, 98.3% long liquidation dominance
- 24H liquidations: $431.57M long vs $53.83M short
- RSI at 24.67: deeply oversold on 1H; next support at $75,300, late April base
The brief break above the 50 MA at $77,443 that preceded the current decline can be seen as a bull trap at the hourly moving average: it attracted buyers at the breakout level, held long enough to build positions, then reversed and is now liquidating those positions on the way down.
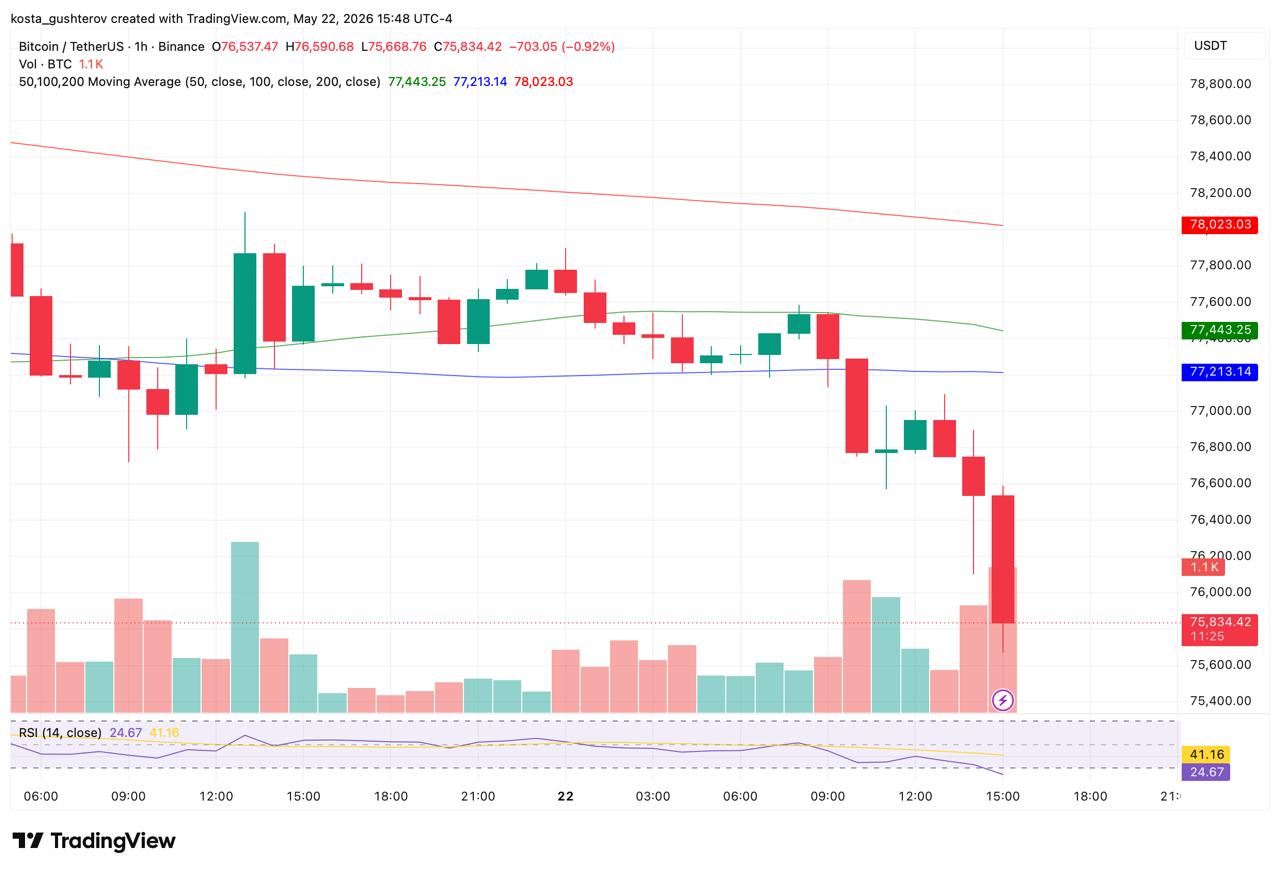
Analytically, the connection between the 50 MA breakout and the current liquidation cascade is an inference: the liquidation data confirms long positions are being forcibly closed at scale but does not specify when those positions were opened. The chart shows price pushing above the 50 MA briefly during the May 22 morning session before a sharp red candle broke the structure. Price then accelerated below both the 50 MA and 100 MA in the sessions that followed. The 200 MA at $78,023 was never threatened and continues declining from above.
RSI at 24.67 with signal at 41.16 reflects a 16.49-point spread, the deepest negative momentum reading on the chart. At 24.67, the RSI is firmly in oversold territory on the 1H, which can produce a mechanical bounce but does not signal that the decline has found its floor.
What the Liquidation Data Confirms
A 98.3% long liquidation ratio in the past hour means this is not a two-sided market event: it is a forced selling cascade from leveraged long positions that are now being liquidated as price falls through every level below the MA50. In the past hour alone, $209.41M in long positions were liquidated against $3.54M in shorts.
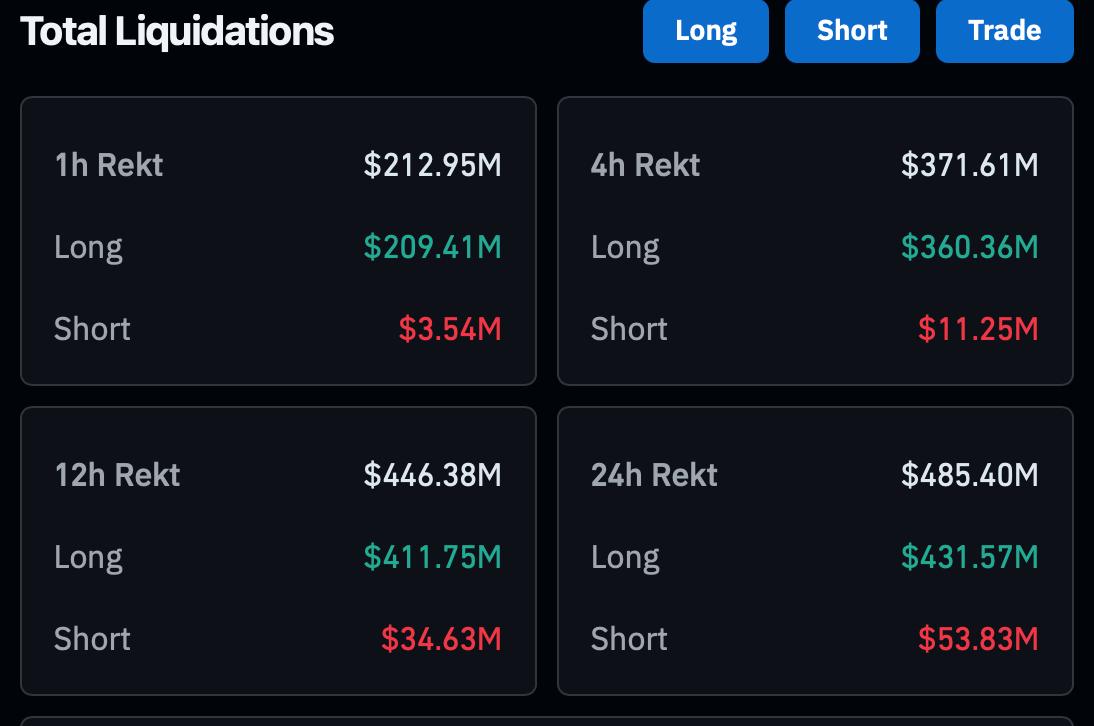
The 4H data from Coinglass shows $360.36M in longs liquidated against $11.25M in shorts, a 97% long dominance ratio. Across 24 hours, $431.57M in long liquidations against $53.83M in short liquidations confirm the cascade has been building throughout the day with long positions accounting for 88.9% of total liquidations.
The CMC20 index is down 2.08% on the 24H at $152.55, with Bitcoin down 2.41% over the same period, confirming the move is broad-based rather than Bitcoin-specific.

Where Price Sits and What Is Below It
The $75,300 level is not an arbitrary support reference: it is the price from which Bitcoin launched its most recent recovery in late April, and whether it holds on this test determines whether the current decline is a retracement into a base or the beginning of a range breakdown. At the time of writing, price is approximately $534 above that level. The three MAs, MA50 at $77,443, MA100 at $77,213, and MA200 at $78,023, are all declining above current price and all functioning as resistance rather than support.
A hold and recovery above $75,300 on the next few 1H candles with RSI beginning to recover above 30 would suggest the oversold condition is producing a floor at the late April base. A break below $75,300 with liquidations continuing to skew long-dominant would confirm the cascade has not found its base and the next structural reference is further below.
The information provided in this article is for educational purposes only and does not constitute financial, investment, or trading advice. Coindoo.com does not endorse or recommend any specific investment strategy or cryptocurrency. Always conduct your own research and consult with a licensed financial advisor before making any investment decisions.

Kosta has reported on cryptocurrency markets and blockchain infrastructure since 2020, bringing over six years of hands-on experience in the crypto industry built through daily tracking of markets, trends, and emerging blockchain developments. Specializing in Bitcoin on-chain analysis, institutional ETF flows, and digital asset price action, his work at Coindoo has been cited by other news agencies and consistently covers market developments with a focus on data-driven reporting across Bitcoin, Ethereum, Solana, and XRP. Over the years, Kosta has contributed to multiple crypto media outlets in different regions, authoring over 6,000 articles across the sector. His reporting spans cryptocurrency markets and the broader fintech industry, tracking not only price action but also the technological and regulatory forces shaping the ecosystem. To support his analysis, Kosta actively leverages on-chain data and metrics from leading platforms such as Santiment, Glassnode, and CryptoQuant, enabling deeper, evidence-based market insights. He believes in the power of transparency and the data that underpins the blockchain ecosystem. His academic background in Marketing Management from Denmark further complements his analytical approach, adding a strong understanding of communication strategy and content positioning to his work.