Bitcoin Dips Below $79,000 – Fed’s Warsh Stresses Inflation

Bitcoin slipped below $79,000 while Federal Reserve Chair Kevin Warsh delivered an inflation-focused speech, as gold declined and major US stock indexes moved only slightly.
Bitcoin remains inside its rising channel
Bitcoin dipped below $79,000 at the time of writing. Its pullback followed a recent high near $81,455 and kept price within the ascending four-hour channel formed after the August 19 rally.
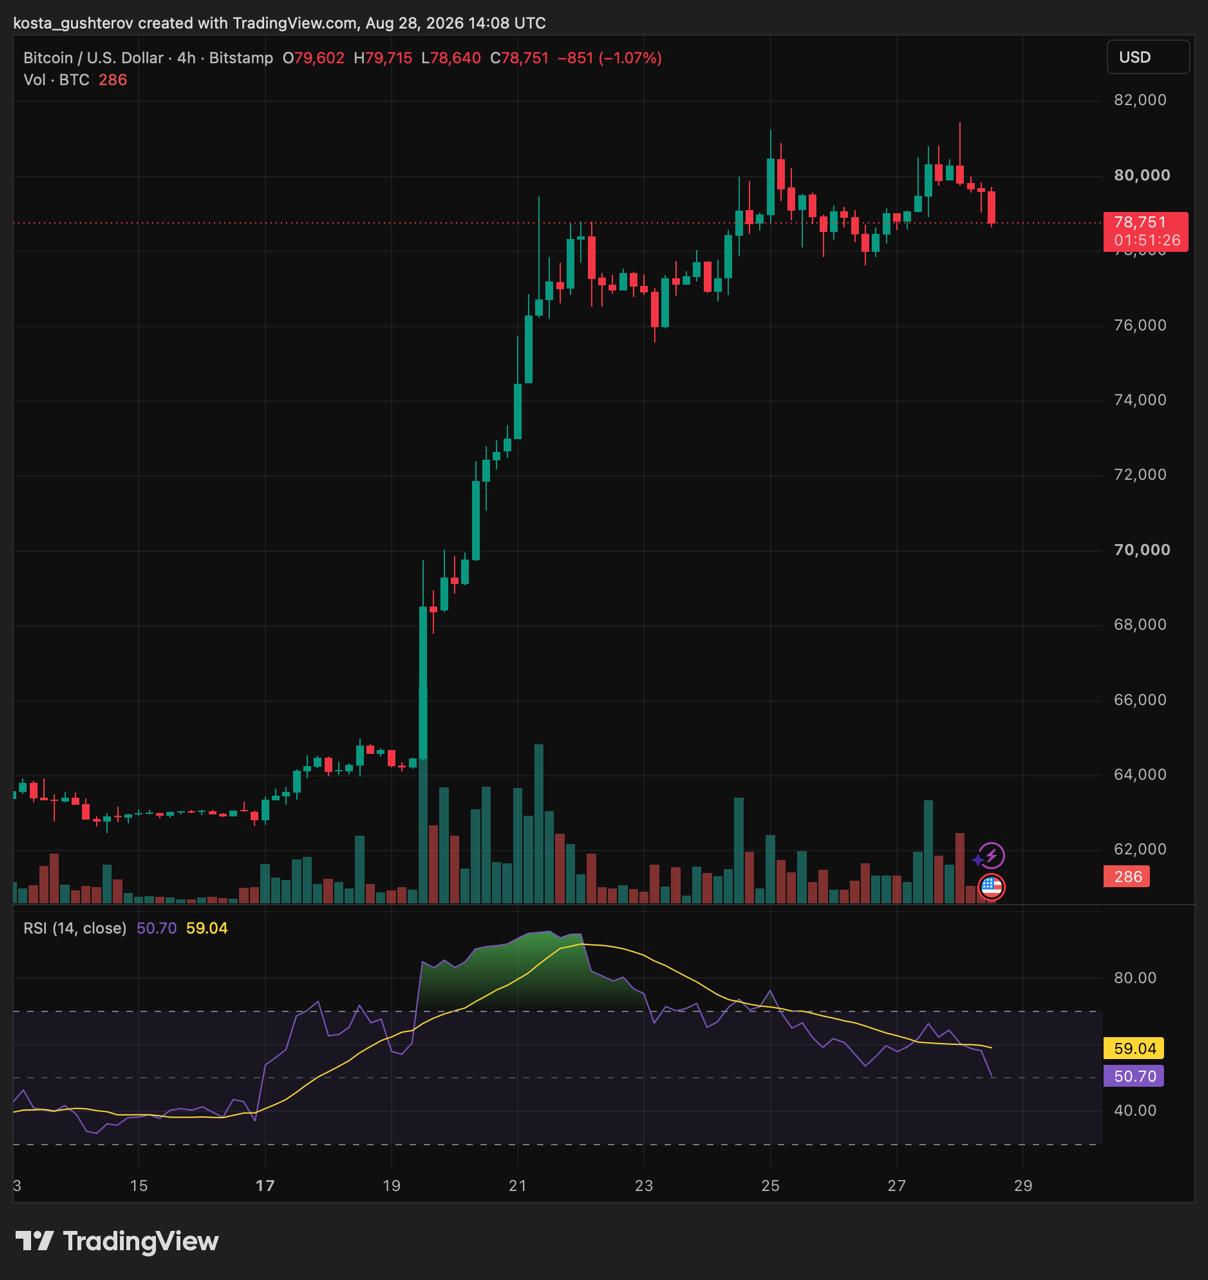
The 50-period simple moving average is rising beneath the formation near $77,800. The 100- and 200-period averages sit much lower, around $70,900 and $67,500. Bitcoin therefore retains a sizeable buffer above its longer averages, with the 50-period line providing the closer reference if selling continues.
Momentum has cooled. The four-hour relative strength index is near 54, below its signal average around 59 and well under the overbought readings reached earlier in the rally. Bitcoin formed higher highs inside the rising channel while the RSI produced lower highs, creating a bearish divergence. The signal does not confirm a reversal, but it shows that buying strength has not kept pace with price and makes the lower channel boundary more important.
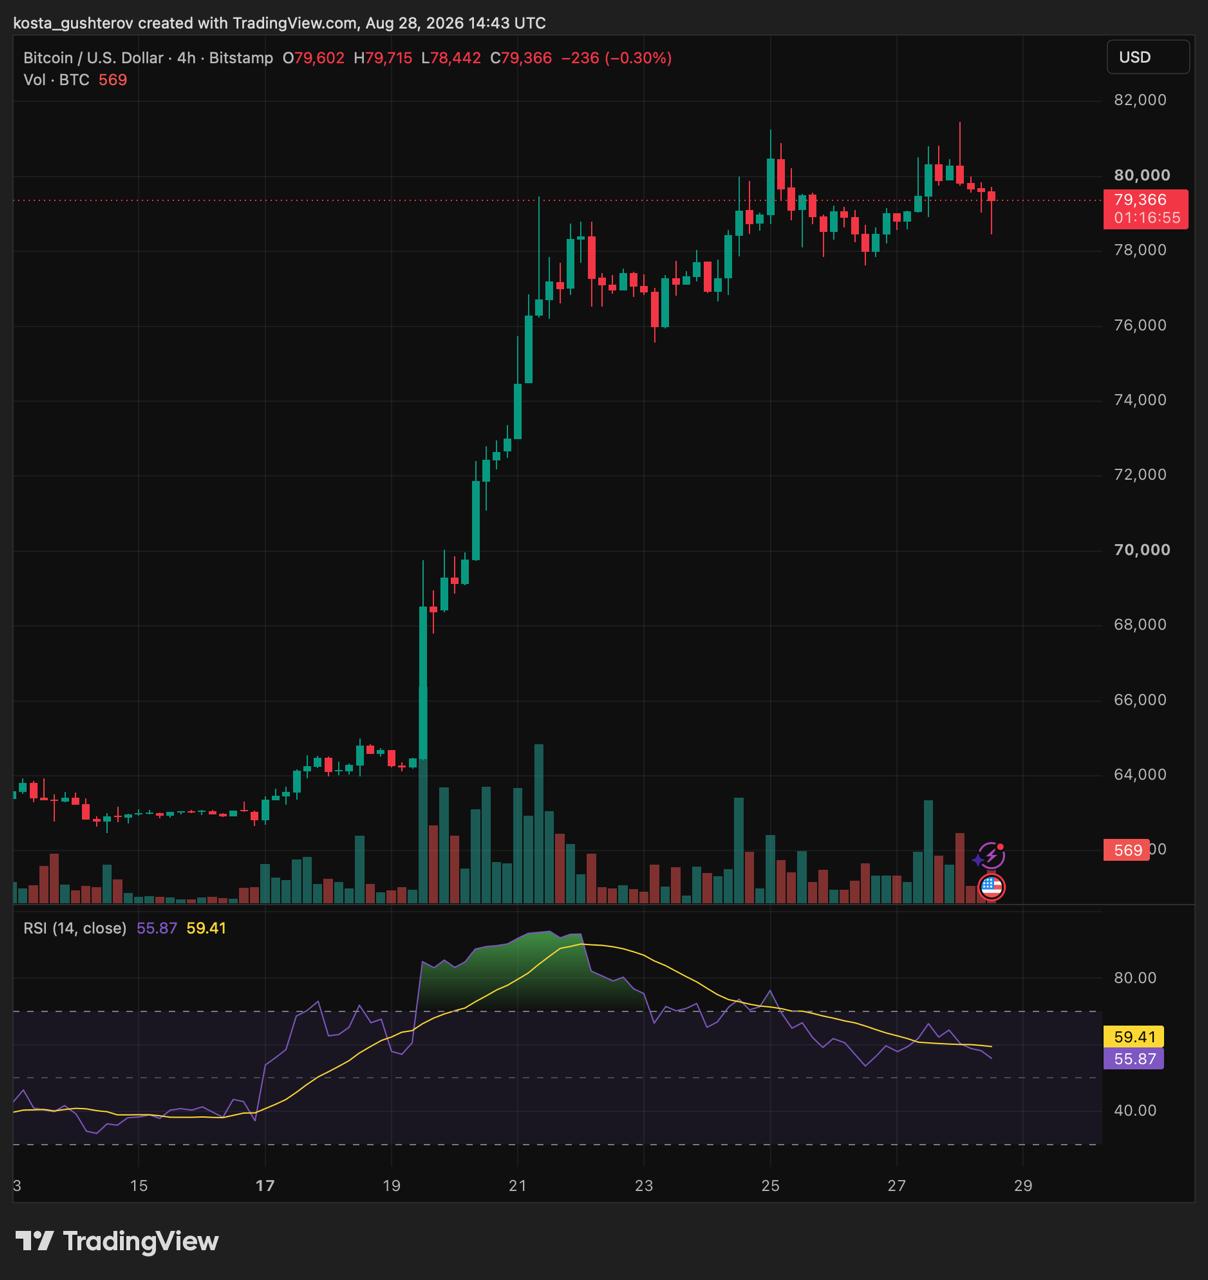
- Update 14:43 UTC
Following the speech, Bitcoin recovered to approximately $79,300.
Warsh keeps the 2% inflation target fixed
Warsh said the summer’s inflation reports were better than expected, but he did not believe the underlying trend had changed meaningfully. The Fed must be confident that inflation is returning to target or, in his words, “we have work to do.” He described the 2% personal consumption expenditures (PCE) inflation target as “firm and fixed.”
He supported that conclusion with broader inflation data. The 12-month PCE inflation rate stood at 3.7%, while the six-month pace was 4.1%. Of the index’s 199 components, 54% recorded price increases above 3% over the past year, compared with 32% during the two decades before the pandemic. The corresponding share over the past six months was 49%. That breadth helps explain why the better summer reports did not convince him that underlying inflation had improved enough.
The rest of his economic assessment offered little evidence of broad stress. Consumer spending remains healthy, labour markets are stable and business investment is rising rapidly. Warsh also said financial conditions are difficult to describe as restrictive, with credit markets showing few signs of policy restraint.
Warsh stopped short of signalling the next rate decision. “I stand here today committed to a discipline, not to a decision,” he said. He also argued that routine forward guidance had “overstayed its welcome” and that markets should form their own expectations from economic information. The rise in the two-year Treasury yield offers one measure of how bond traders initially interpreted the speech, even though Warsh did not announce a rate path.
Short- and long-term Treasury yields move apart
Between the start of Warsh’s speech at 14:00 UTC and a market snapshot at 14:47 UTC, the US two-year Treasury yield rose from approximately 4.24% to 4.30%, an increase of about 5 basis points. It briefly reached 4.32% during that period.
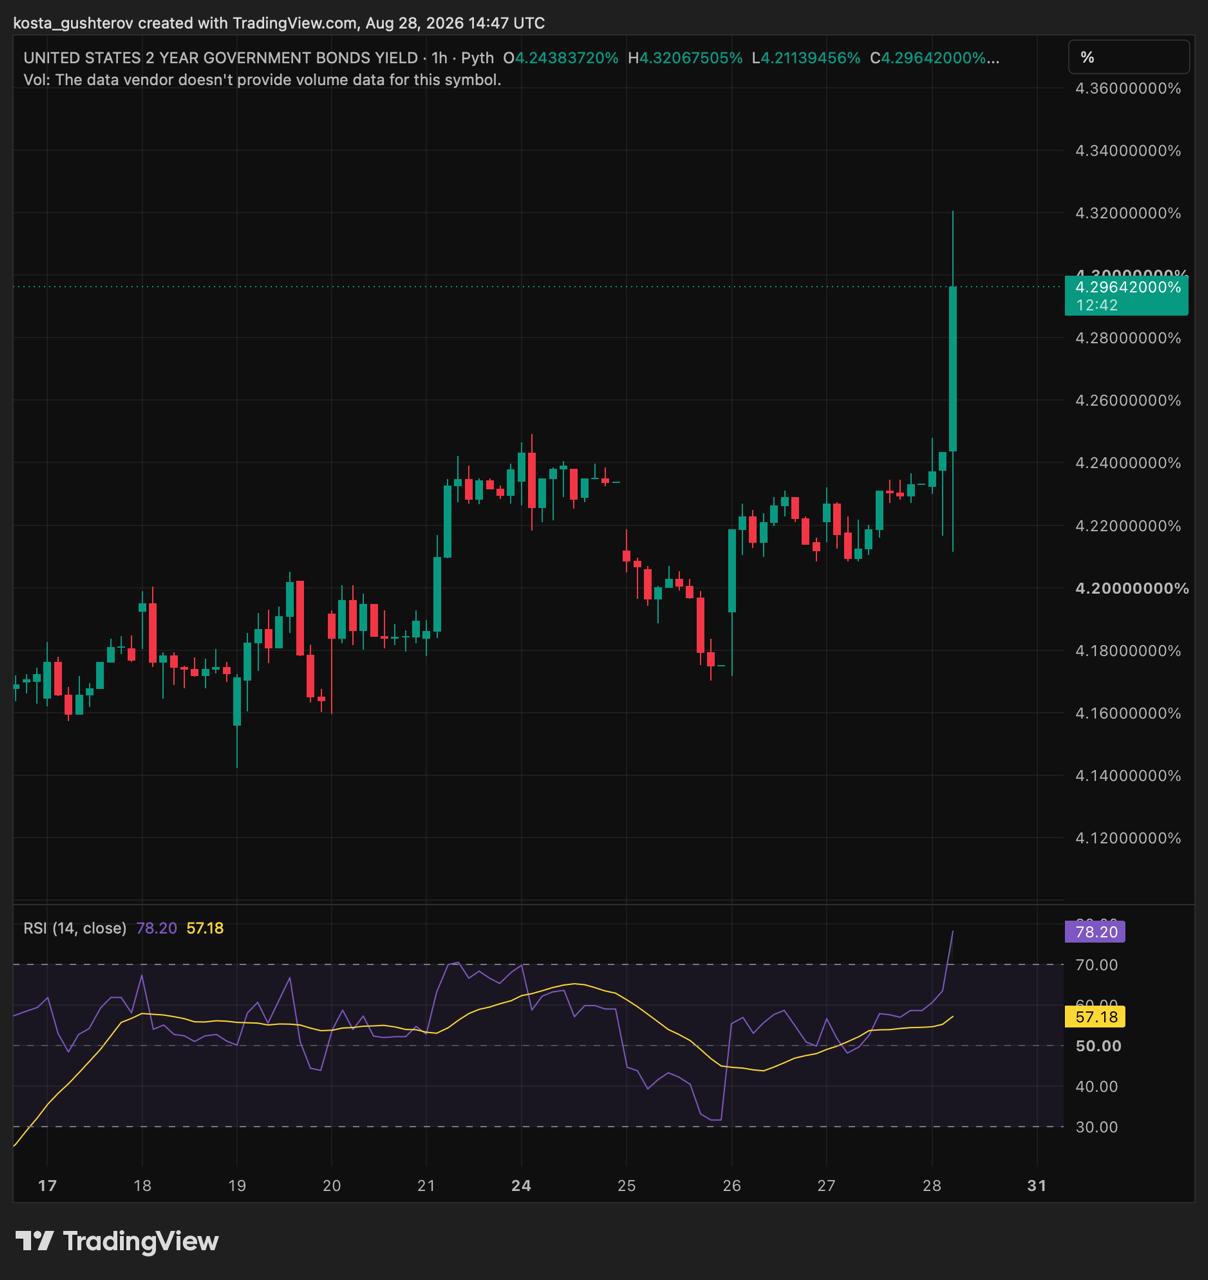
The 30-year Treasury yield moved in the opposite direction, falling from approximately 5.18% to 5.15%, or about 3 basis points. One basis point equals 0.01 percentage points. Because bond prices and yields move inversely, the figures indicate that two-year note prices fell while 30-year bond prices rose.
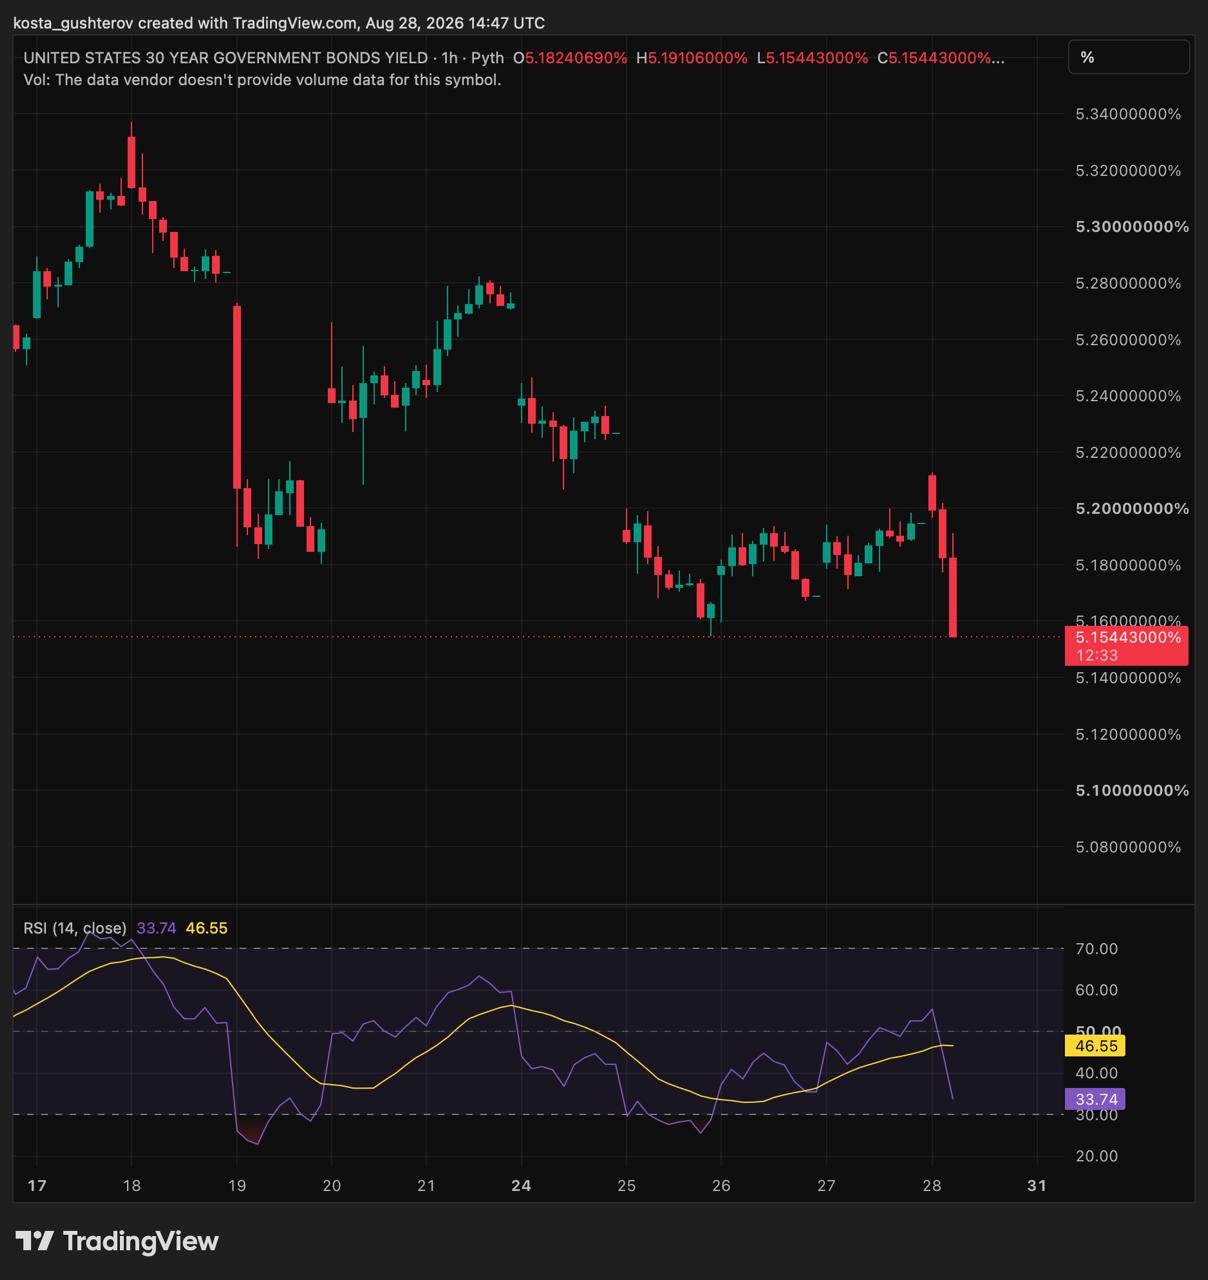
The gap between the two yields narrowed by roughly 8 basis points. This flatter yield curve is consistent with greater concern about near-term interest-rate policy alongside slightly lower yields on long-term debt, although the charts alone cannot establish what caused either move.
The distinction matters because the Treasury’s recent expansion of long-bond buybacks applies to older 10-to-30-year securities and is intended to improve market liquidity. It is separate from Federal Reserve rate policy. The two-year yield is more sensitive to expectations for near-term Fed decisions, while the 30-year yield also reflects longer-term inflation, growth and demand for government debt.
Spot gold extended its losses and was down just over 0.7%, trading near $4,570 per ounce at the time of writing.
Changes in the main US stock indexes were much smaller. The S&P 500 was down roughly 0.1% and the Nasdaq was about 0.2% lower. The Dow was close to flat, showing a gain of approximately 0.1%.
The channel defines Bitcoin’s next test
The lower channel boundary and the rising 50-period average near $77,800 provide the nearest areas to watch if selling continues. A four-hour close beneath the formation would damage the post-rally structure and shift greater attention towards that moving average.
Bitcoin first needs to recover $80,000. The recent high around $81,500 is the more demanding barrier. A four-hour close above it with a stabilising RSI would improve the continuation case. Another rejection would preserve the existing consolidation.
This article is provided for informational purposes only and does not constitute financial or investment advice.



Kosta has reported on cryptocurrency markets and blockchain infrastructure since 2020, bringing over six years of hands-on experience in the crypto industry built through daily tracking of markets, trends, and emerging blockchain developments. Specializing in Bitcoin on-chain analysis, institutional ETF flows, and digital asset price action, his work at Coindoo has been cited by other news agencies and consistently covers market developments with a focus on data-driven reporting across Bitcoin, Ethereum, Solana, and XRP. Over the years, Kosta has contributed to multiple crypto media outlets in different regions, authoring over 6,000 articles across the sector. His reporting spans cryptocurrency markets and the broader fintech industry, tracking not only price action but also the technological and regulatory forces shaping the ecosystem. To support his analysis, Kosta actively leverages on-chain data and metrics from leading platforms such as Santiment, Glassnode, and CryptoQuant, enabling deeper, evidence-based market insights. He believes in the power of transparency and the data that underpins the blockchain ecosystem. His academic background in Marketing Management from Denmark further complements his analytical approach, adding a strong understanding of communication strategy and content positioning to his work.