S&P 500 Hits a Record Again – What History Says for Bitcoin
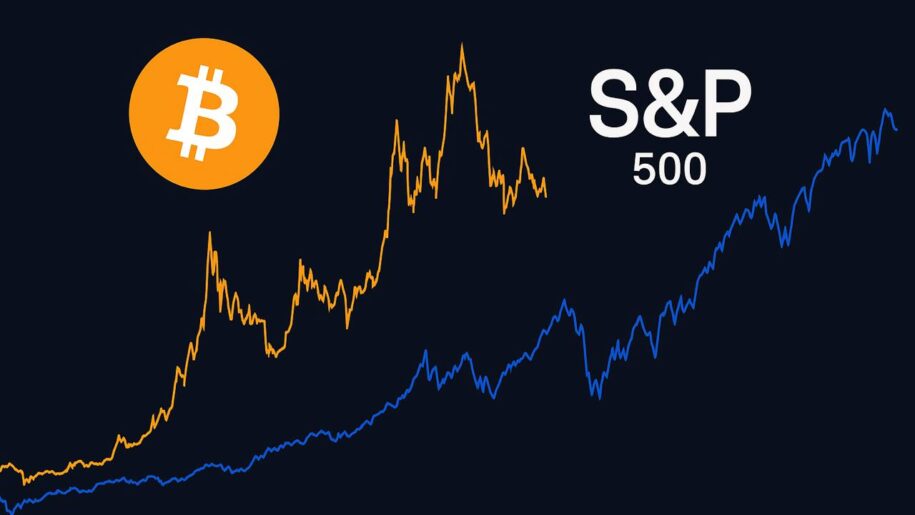
With the S&P 500 back at a record, Bitcoin sits below its earlier high. History shows why that gap deserves more than a simple risk-on explanation.
Key Takeaways
- The S&P 500 rose above 7,840 as Treasury yields, oil prices and the dollar eased.
- Bitcoin rose after some earlier stock-market records and fell after others.
- The conditions behind the record have mattered far more than the record itself.
Stocks reached a record as bond pressure eased
The S&P 500 climbed above 7,840 on October 6, reaching a new all-time high as oil prices retreated and Treasury yields eased. The Washington Post reported that the index had moved above that level, while Reuters noted that the 10-year Treasury yield had slipped about 2.1 basis points to 5.28%. Optimism around AI-linked companies and the coming earnings season added to the move.
The dollar also eased after recent strength, helping lift the mood across dollar-priced markets. Yet long-term borrowing costs remain high, with the 30-year Treasury yield near 5.66% during the session. The move therefore offered markets some relief without returning them to the low-yield environment behind earlier crypto rallies.
For Bitcoin, the record gives context rather than a conclusion. Investors were willing to extend risk exposure in the parts of equities leading the move, but the next question is whether lower yields and a softer dollar can persist long enough to influence crypto. Our analysis of the dollar’s role in Bitcoin’s macro backdrop explains why that follow-through can matter more than one strong session for stocks.
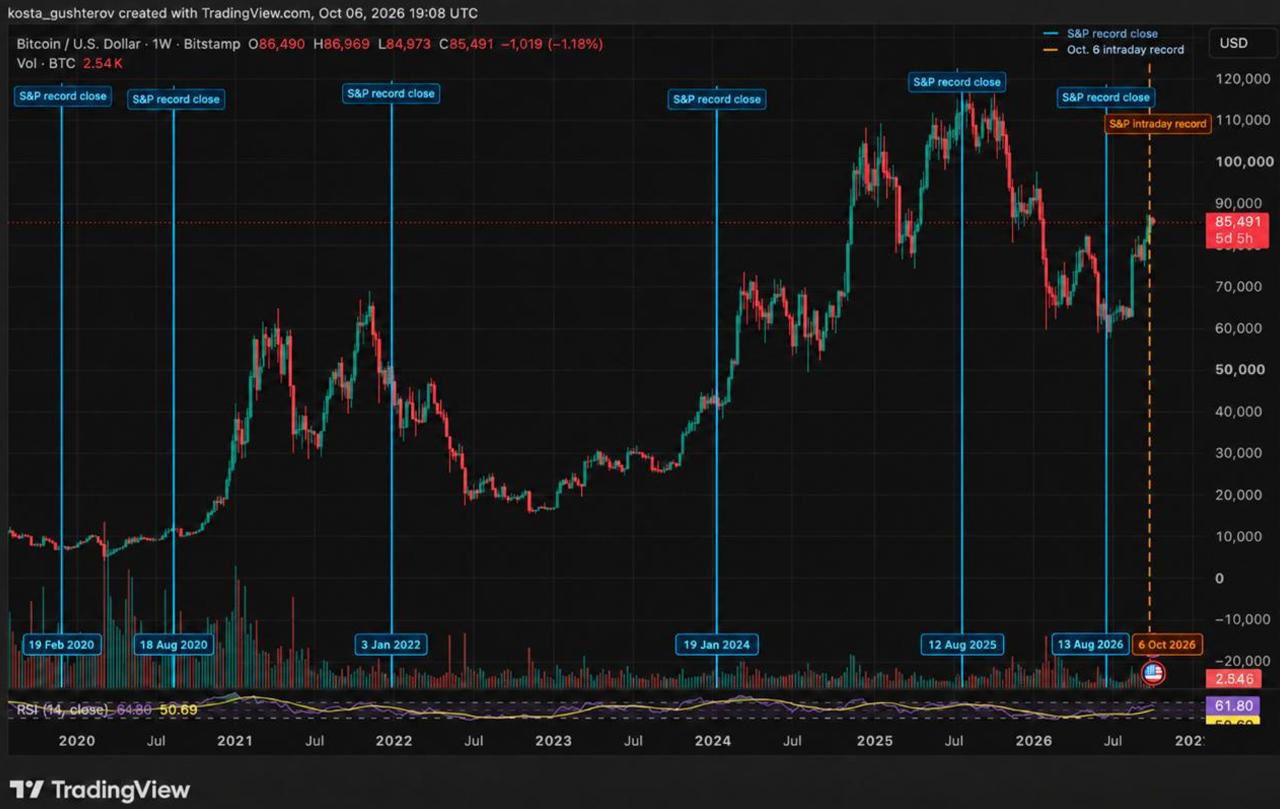
The same stock-market event produced very different Bitcoin outcomes
A fresh S&P 500 high can be a useful date to examine, but it has never worked as a stand-alone Bitcoin signal. The August 2025 stretch, for example, should be read as one market episode because it produced consecutive records during the same advance. Treating each new high as a separate Bitcoin trigger would overstate the evidence.
2020 showed both sides within six months
When the S&P 500 set a record in February 2020, Bitcoin traded near $9,600. The COVID-19 shock arrived soon after, sending investors toward cash and causing Bitcoin to fall sharply alongside equities. The record marked the end of one market phase rather than the start of a durable advance.
August produced the opposite result. By then, rates were low, central banks had supplied extraordinary liquidity and the dollar had weakened. Bitcoin did not move in a straight line after that S&P 500 record, yet the months that followed became part of the advance that carried it into the 2020–21 bull market. The contrast with February came from the conditions surrounding the two records.
2022 and 2024 added two more answers
The S&P 500 reached another closing high on January 3, 2022, with Bitcoin near $46,500. Markets were already shifting toward Federal Reserve tightening, rising yields and more expensive funding. Bitcoin’s recovery attempts gave way to a broader decline as investors reassessed risk assets under higher rates.
January 2024 developed differently again. Bitcoin initially pulled back after U.S. spot Bitcoin ETFs began trading, as early buyers took profit and the market absorbed a major structural change. It later reached a new all-time high in March. That sequence showed how a crypto-specific catalyst can shape Bitcoin’s path even while equities remain part of the wider market backdrop.
The historical pattern: Bitcoin performed well when stock-market strength coincided with easier financial conditions or powerful crypto-specific demand. It struggled when a liquidity shock or tighter policy took control of markets.
Today’s backdrop still looks different
The immediate setup does share one feature with the more supportive episodes: financial pressure eased during the session. Lower oil prices calmed some inflation concerns, while lower yields and a weaker dollar gave equities room to resume their advance.
However, the 10-year yield remains above 5%, far from the rate environment that supported the 2020-21 run. The dollar’s decline also followed a period of strength, leaving open whether the move develops into a broader trend or remains a short-lived reaction to changing rate expectations.
Bitcoin has its own source of momentum, too. Steady spot buying offers different information from a move driven mainly by futures leverage or short covering, making the asset’s internal market data at least as relevant as the S&P 500’s performance.
What can give the record more meaning for Bitcoin
- Treasury yields
- A multi-session decline would reduce a major hurdle for risk assets. A renewed rise would quickly restore pressure.
- The U.S. dollar
- Further weakness could make global financial conditions less restrictive. A return to recent highs would point in the other direction.
- Bitcoin’s spot demand
- Sustained buying in the underlying market would offer firmer evidence than a rapid derivatives-led price move.
- Market breadth
- A rally centred on a handful of AI-linked giants carries a different message from broad participation across stocks, bonds and other risk assets.
The S&P 500’s new high reflects a session in which equity investors accepted more risk as yield and dollar pressure eased. Earlier record periods show that Bitcoin can rally, lag or fall after the same event. What happens next in yields, the dollar and Bitcoin’s own demand will determine whether this remains an equity-led move or develops into a broader shift in risk appetite.
This article is for informational purposes only and does not constitute investment or trading advice. Historical market performance does not guarantee future results.



Kosta has reported on cryptocurrency markets and blockchain infrastructure since 2020, bringing over six years of hands-on experience in the crypto industry built through daily tracking of markets, trends, and emerging blockchain developments. Specializing in Bitcoin on-chain analysis, institutional ETF flows, and digital asset price action, his work at Coindoo has been cited by other news agencies and consistently covers market developments with a focus on data-driven reporting across Bitcoin, Ethereum, Solana, and XRP. Over the years, Kosta has contributed to multiple crypto media outlets in different regions, authoring over 6,000 articles across the sector. His reporting spans cryptocurrency markets and the broader fintech industry, tracking not only price action but also the technological and regulatory forces shaping the ecosystem. To support his analysis, Kosta actively leverages on-chain data and metrics from leading platforms such as Santiment, Glassnode, and CryptoQuant, enabling deeper, evidence-based market insights. He believes in the power of transparency and the data that underpins the blockchain ecosystem. His academic background in Marketing Management from Denmark further complements his analytical approach, adding a strong understanding of communication strategy and content positioning to his work.