Zcash Hits $512 Wall as Privacy Pools Absorb 30% of Supply

ZEC entered August 6 testing the main resistance level of its six-session recovery after closing the previous day at $511, just below the 0.5 Fibonacci retracement at $512.
Price briefly reached $515 before returning to around $510 at the time of writing, leaving the breakout unresolved and shifting attention to the daily close.
Key Takeaways
- ZEC is testing the resistance that stopped its previous rebound, but weak volume and a faded intraday move leave the breakout unconfirmed.
- Funding has turned mildly positive without reaching an obvious extreme relative to recent readings.
- Growth in shielded balances may be reducing ZEC’s liquid supply, although those coins remain transferable and are not necessarily inactive.
- If resistance holds, the first support sits near $496, followed by the 50-day SMA at $477 and the 0.382 Fibonacci level at $470.
ZEC’s Six-Day Recovery Reaches Key Resistance
The $512 area also stopped ZEC’s rebound around July 26, after which price returned toward the lower part of its short-term range. Clearing it would therefore break both the Fibonacci retracement and the ceiling that blocked the previous recovery attempt.
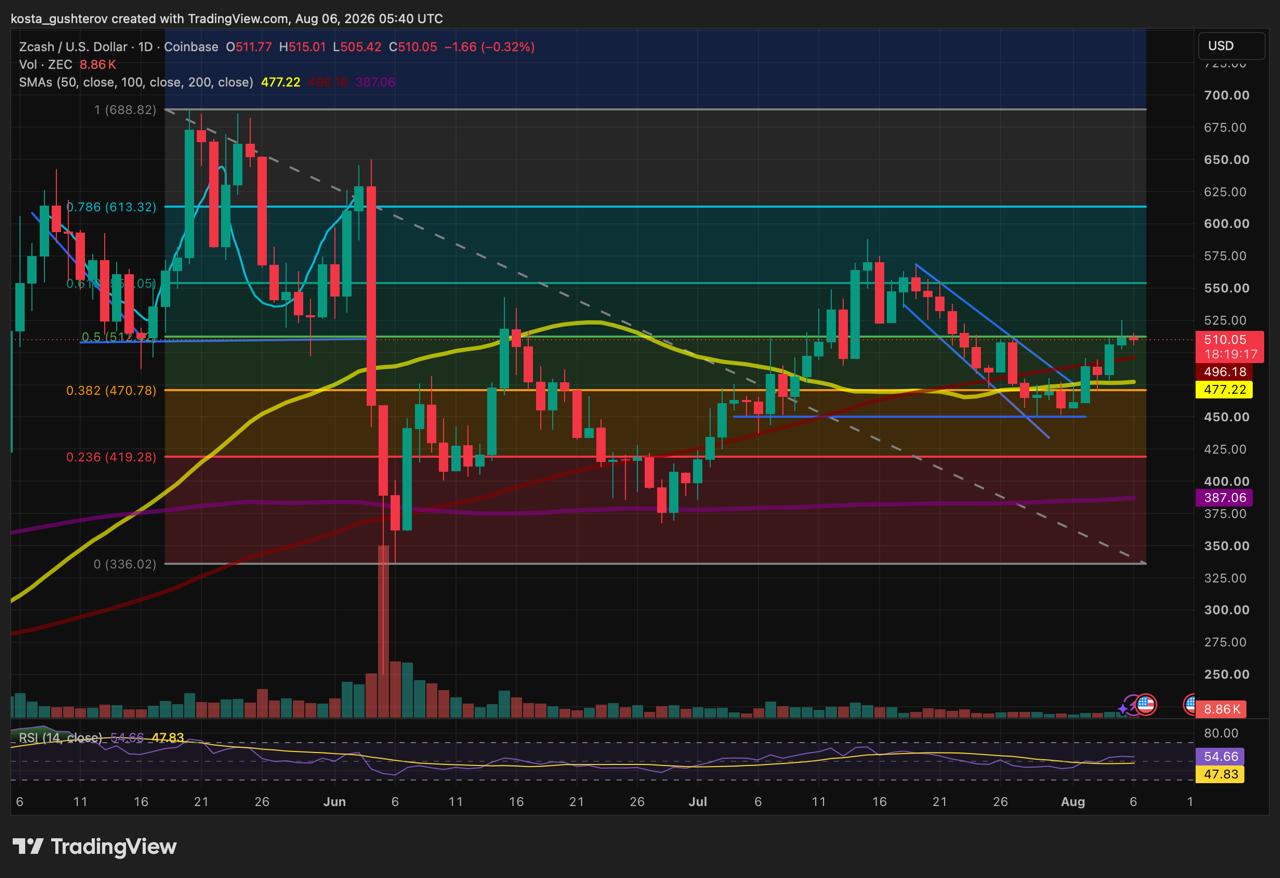
ZEC reached the level after escaping the descending channel formed during the second half of July. The sequence of higher highs points to improving short-term momentum, while the Relative Strength Index has recovered to approximately 54.7 without approaching overbought conditions.
Trading activity has remained subdued throughout the advance, leaving the move without strong participation or conviction. The August 6 volume reading is also based on an incomplete daily session, making the final figure more useful than the early total.
A daily close above $512 with stronger volume would bring the 0.618 Fibonacci retracement near $554 into focus. Without broader participation, the move remains vulnerable to the same type of rejection seen in late July.
Funding Turns Mildly Positive
Zcash’s eight-hour open-interest-weighted funding rate stood at 0.0081% at 03:00 on August 6.
Positive funding means traders holding long perpetual-futures positions are paying those positioned short.
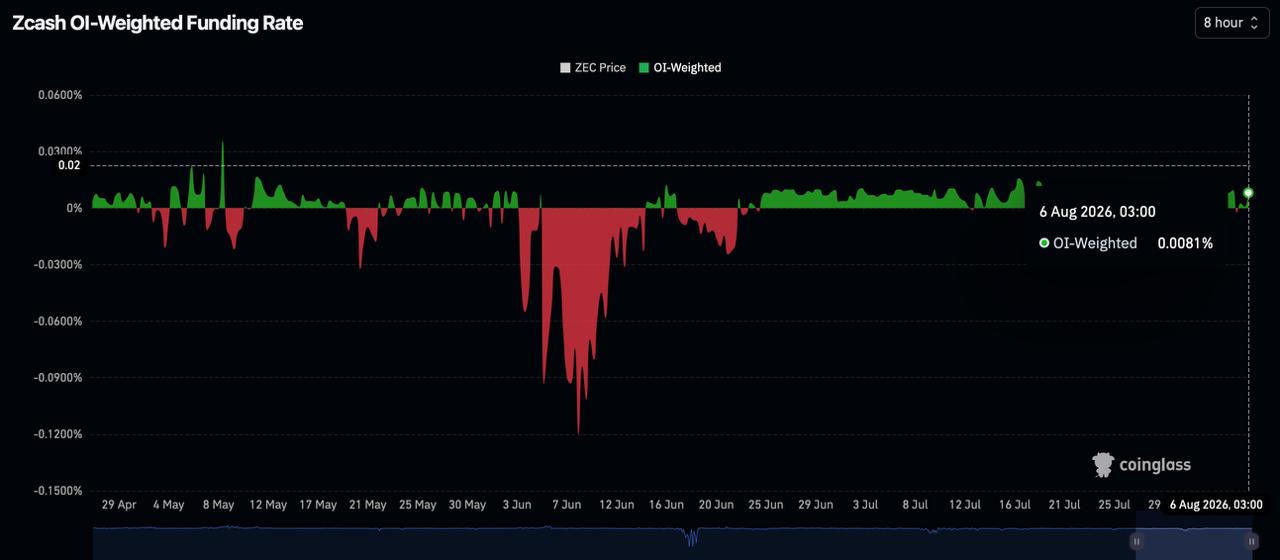
The rate remains below the elevated positive readings recorded during parts of May, suggesting that the long bias has not reached an obvious funding-rate extreme.
This contrasts with the June sell-off, when weighted funding briefly fell toward -0.12%. That deeply negative reading was consistent with aggressive short positioning or strong demand for downside protection. The return above zero indicates that derivatives sentiment has shifted alongside the price recovery.
Funding does not establish whether spot buyers are accumulating ZEC. It only shows that funding no longer reflects the same downside bias seen during the June decline. A rapid move toward unusually high positive readings would increase the risk of a long-liquidation reversal.
Shielded Balances May Be Reducing Liquid Supply
A separate longer-term development is the increase in the amount of ZEC held in shielded balances.
According to analysis shared by Delphi Digital, the proportion of circulating ZEC held in the shielded pool rose from roughly 8% in early 2024 to around 30% by May 2026. The analysis estimated that approximately 4.9 million ZEC had moved into shielded balances.
Those coins are not permanently removed from circulation. They can still be transferred within the shielded pool or returned to transparent addresses, and the data does not prove that every shielded balance is inactive or unavailable for trading.
Delphi’s argument is that users who move funds into shielded balances for privacy may be less likely to return them quickly to transparent addresses or exchanges. If a meaningful share remains outside active exchange liquidity, ZEC’s effective tradable float could be smaller than its circulating supply suggests.
Under that condition, new demand may move price more sharply because fewer coins are immediately available for sale. The available data, however, does not establish that shielded balances caused the current recovery.
Delphi also identified two possible sources of future demand. Nasdaq-listed Cypherpunk has targeted ownership of 5% of the ZEC supply, while Grayscale has filed for a US Zcash exchange-traded product.
Neither development establishes recurring purchases or approved investment-product inflows. They could create future demand alongside a possible reduction in liquid supply, but there is no evidence that a supply shortage is already driving ZEC’s price.
READ MORE:

Solana Gets a New 7%–8% Yield Vault for USDC
Support Sits at $496, Followed by $477 and $470
A rejection near $512 would not immediately invalidate the recovery. The first support sits at the 100-day simple moving average near $496.
Below that level, the 50-day SMA at approximately $477 forms support alongside the 0.382 Fibonacci retracement at $470. Buyers defended the broader $471-$477 region during the final days of July before the current recovery began.
The moving-average structure is not fully bullish because the 50-day SMA remains below the 100-day average. Price trading above both averages is still an improvement from the late-July structure and gives buyers two levels to defend before a deeper retracement becomes more likely.
Failure to hold the 100-day SMA would return attention to the 50-day SMA at $477 and the Fibonacci level at $470. The August 6 close will show whether buyers can hold the recovery or whether attention returns to the support levels below.
- Methodology: This article combines a Coinbase ZEC/USD daily chart captured on August 6, 2026, an eight-hour Coinglass OI-weighted funding chart and analysis published by Delphi Digital. Moving averages, Fibonacci levels, RSI, volume and price data are taken from the Coinbase chart, while funding data is taken from Coinglass.
- Disclaimer: This article is provided for informational and educational purposes only and does not constitute financial or investment advice. Funding rates, technical levels and estimates of tradable supply can change rapidly.



Kosta has reported on cryptocurrency markets and blockchain infrastructure since 2020, bringing over six years of hands-on experience in the crypto industry built through daily tracking of markets, trends, and emerging blockchain developments. Specializing in Bitcoin on-chain analysis, institutional ETF flows, and digital asset price action, his work at Coindoo has been cited by other news agencies and consistently covers market developments with a focus on data-driven reporting across Bitcoin, Ethereum, Solana, and XRP. Over the years, Kosta has contributed to multiple crypto media outlets in different regions, authoring over 6,000 articles across the sector. His reporting spans cryptocurrency markets and the broader fintech industry, tracking not only price action but also the technological and regulatory forces shaping the ecosystem. To support his analysis, Kosta actively leverages on-chain data and metrics from leading platforms such as Santiment, Glassnode, and CryptoQuant, enabling deeper, evidence-based market insights. He believes in the power of transparency and the data that underpins the blockchain ecosystem. His academic background in Marketing Management from Denmark further complements his analytical approach, adding a strong understanding of communication strategy and content positioning to his work.