Ethereum Pullback Risk Builds Despite $3,000 Call

Ethereum has returned to the resistance area that rejected several recent advances. The chart now favours a short-term pullback, while Ali Martinez’s on-chain analysis presents a more bullish path over a wider timeframe.
Key Takeaways
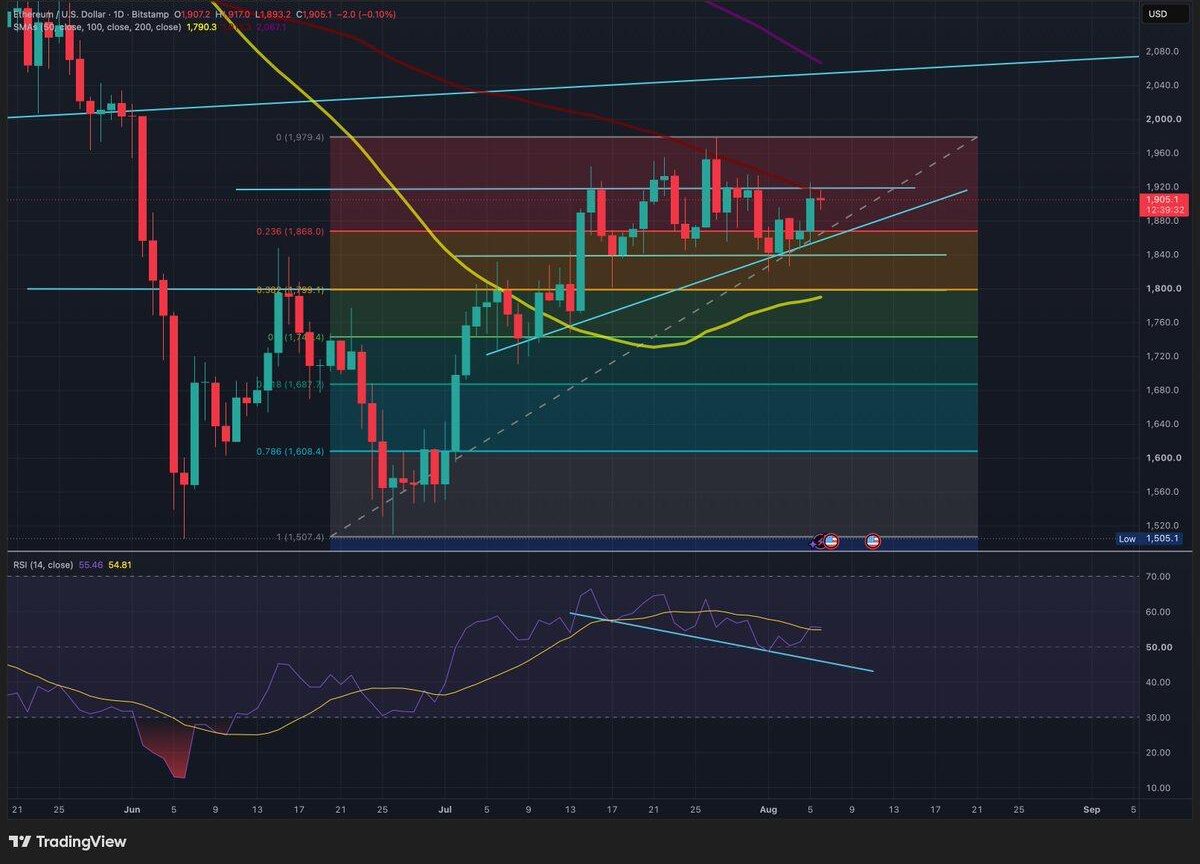
- ETH is testing repeated resistance near $1,920, reinforced by the declining 100-day SMA.
- The first important pullback zone sits near $1,870, where a Fibonacci level and two trendlines converge.
- Ali Martinez’s MVRV framework points toward $2,300 before the larger $3,000 target.
- Positive OI-weighted funding shows that derivatives positioning remains tilted toward longs, but it does not determine the next price move.
At the time of writing on August 6, Ethereum was trading near $1,900 after reaching an intraday high around $1,917.
Horizontal resistance near $1,920 has already stopped several attempts since mid-July. The declining 100-day simple moving average now reinforces the same area, increasing the risk that ETH retraces before making another sustained attempt higher.
The 200-day SMA remains considerably higher around $2,070.
Resistance Favors a Short-Term Pullback
ETH has continued to form higher lows along the rising structure that began at its late-June bottom. That recovery remains intact, but price has reached the upper boundary of its current range.
The Relative Strength Index stood near 55.5, slightly above its moving average around 54.8. Momentum remains positive, although the RSI’s lower highs show that the latest advance has not been accompanied by stronger momentum.
If today’s candle closes in red after another rejection near $1,920, it would strengthen the case for a short-term pullback toward the $1,870 confluence zone. A bearish move would be confirmed only if ETH then loses the rising trendline and closes below that support, while a daily close above $1,920 would weaken the pullback thesis.
Why $1,870 Matters
The first important support sits near $1,870, where the 0.236 Fibonacci retracement meets two trendline references.
One is the upper boundary of the smaller descending channel that ETH previously broke above. A return to that line would test whether former resistance has become support.
The same area also meets the lower trendline of the larger ascending channel.
That creates a three-part confluence:
- the 0.236 Fibonacci retracement;
- the upper boundary of the broken descending channel;
- the lower support line of the broader ascending structure.
A hold in this area would preserve the higher-low structure and could create a cleaner base for another attempt higher.
A decisive break below it would shift attention toward horizontal support near $1,840. Below that, the broader $1,790-$1,800 zone combines the 0.382 Fibonacci retracement with the 50-day SMA.
- Hold near $1,870: The rising structure remains intact.
- Break below $1,870: Price could move toward $1,840.
- Break below $1,840: The $1,790-$1,800 region becomes the main lower support.
Martinez’s On-Chain View Points Higher
Ali Martinez takes a more bullish view over a longer timeframe.
In an analysis published on X, Martinez argued that Ethereum entered a stronger valuation regime after moving above its MVRV 0.8 Pricing Band near $1,800.
The MVRV framework compares Ethereum’s market value with the average value at which its supply last moved on-chain.
ETHEREUM IS HEADING TO $3,000
1/6 🧵👇
— Ali Charts (@alicharts) August 6, 2026
Martinez identified Ethereum’s realized price near $2,300 as the next major reference. He then highlighted $3,000 as the larger target if the recovery continues.
A pullback would not necessarily invalidate that outlook. ETH could retest support, preserve its broader rising structure and resume the advance later.
Martinez also pointed to an MVRV Momentum golden cross. He highlighted four earlier signals that were followed by gains ranging from approximately 50% to 166%.
The sample is small, and those historical moves should not be treated as a forecast. Liquidity, macro conditions and investor demand differ between market cycles.
$3,000 May Also Create Resistance
Martinez’s data indicates that more than 10 million ETH previously changed hands around $3,000.
Some holders who bought near that level may sell when price returns to their entry point. The historical acquisition cluster could therefore slow the move even if Ethereum eventually reaches the target.
Funding Shows a Long Bias, Not a Directional Signal
Ethereum’s eight-hour OI-weighted funding rate has remained mostly positive since early July.
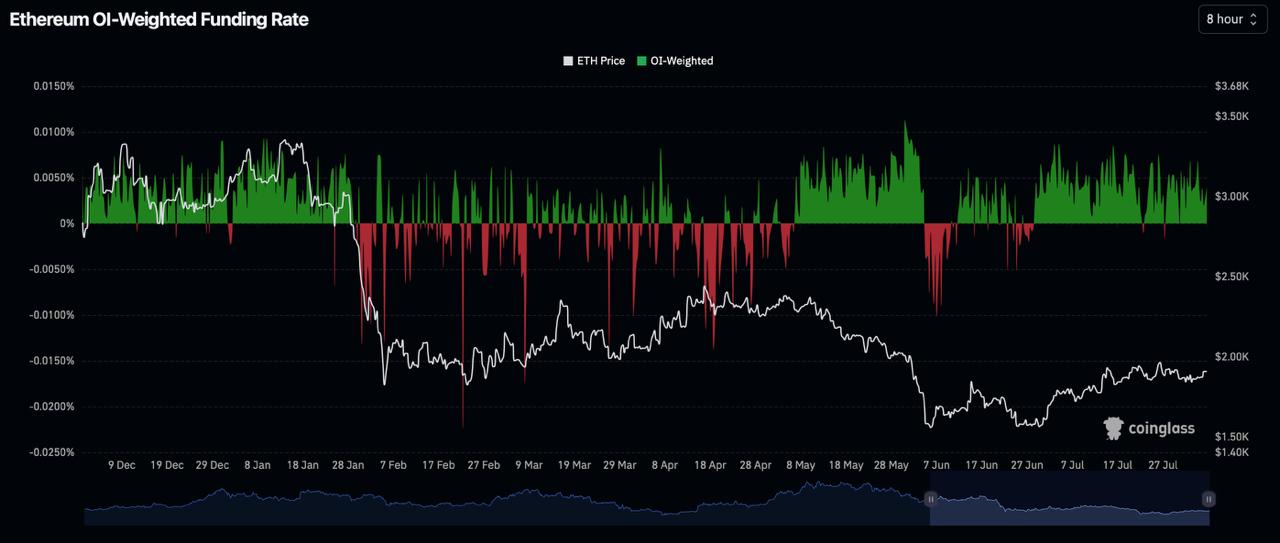
Positive funding means traders holding perpetual-futures long positions are generally paying those positioned short. Weighting the calculation by open interest gives more influence to markets carrying larger leveraged positions.
The data shows that positioning remains tilted toward longs. Recent readings have stayed below the local peak near 0.01% recorded in late May, but that comparison alone does not show whether leverage is excessive.
Open interest, leverage ratios and liquidation concentrations would also be needed to judge how crowded the trade has become.
Funding therefore works best as a sentiment measure here. Traders are leaning bullish, but the data cannot show whether ETH will break resistance immediately or first return to support.
A pullback while funding remains positive could put leveraged longs under pressure. A successful support retest would bring trader positioning back into line with Martinez’s wider bullish thesis.
The Pullback and Bullish Target Can Both Be Valid
The chart currently supports caution after Ethereum’s return to repeated resistance. A retracement toward the nearby confluence would test whether the rising structure still has buyer support.
Martinez’s $2,300 and $3,000 targets belong to a wider timeframe, while CoinGlass funding shows that derivatives traders remain biased toward the bullish outcome.
A successful support retest would connect the two views: short-term weakness followed by a possible continuation of the broader recovery.
- Methodology: This article combines an ETH/USD daily chart captured on August 6, 2026, Ali Martinez’s MVRV analysis and CoinGlass OI-weighted funding-rate data. Technical levels, trendlines, moving averages and RSI readings are taken from the chart. Historical MVRV performance and the $3,000 transaction cluster are attributed to Martinez.
- Disclaimer: This article is provided for informational and educational purposes only and does not constitute financial or investment advice. Technical levels, on-chain indicators and funding rates can change rapidly and do not guarantee future price performance.



Kosta has reported on cryptocurrency markets and blockchain infrastructure since 2020, bringing over six years of hands-on experience in the crypto industry built through daily tracking of markets, trends, and emerging blockchain developments. Specializing in Bitcoin on-chain analysis, institutional ETF flows, and digital asset price action, his work at Coindoo has been cited by other news agencies and consistently covers market developments with a focus on data-driven reporting across Bitcoin, Ethereum, Solana, and XRP. Over the years, Kosta has contributed to multiple crypto media outlets in different regions, authoring over 6,000 articles across the sector. His reporting spans cryptocurrency markets and the broader fintech industry, tracking not only price action but also the technological and regulatory forces shaping the ecosystem. To support his analysis, Kosta actively leverages on-chain data and metrics from leading platforms such as Santiment, Glassnode, and CryptoQuant, enabling deeper, evidence-based market insights. He believes in the power of transparency and the data that underpins the blockchain ecosystem. His academic background in Marketing Management from Denmark further complements his analytical approach, adding a strong understanding of communication strategy and content positioning to his work.