Zcash Price Pulls Back From $1,680 – Is the Rally Losing Steam?
Zcash retreated after passing its August high and reaching near $1,680. Daily momentum is weakening, while the weekly chart still supports the broader advance.
Daily momentum weakens while weekly RSI holds
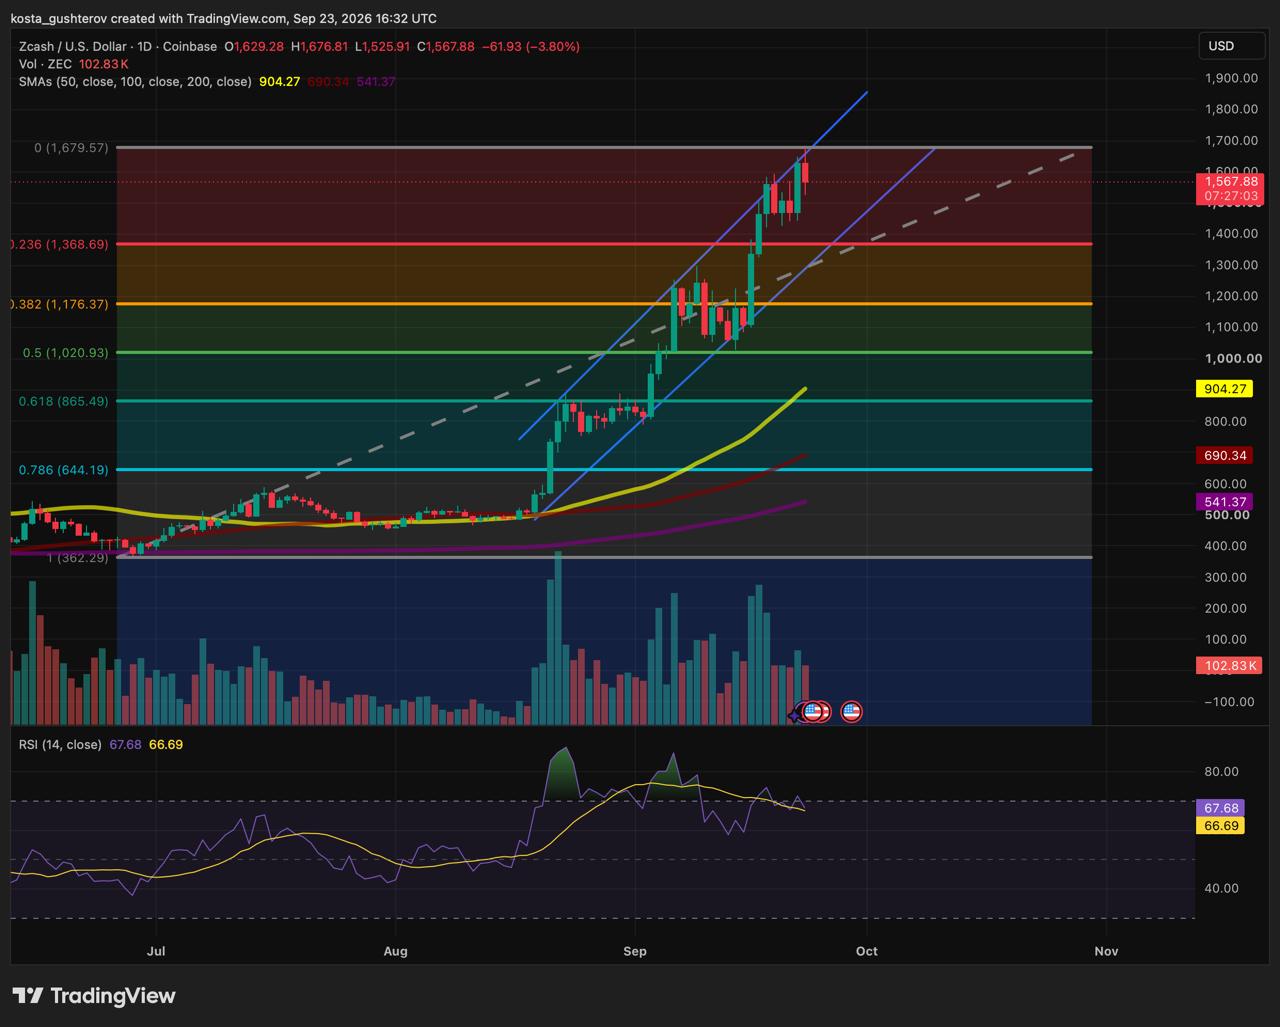
ZEC reached $1,676 before falling to approximately $1,568 on the Coinbase daily chart at 16:32 UTC on September 23. The open daily candle was down 3.8% at that point.
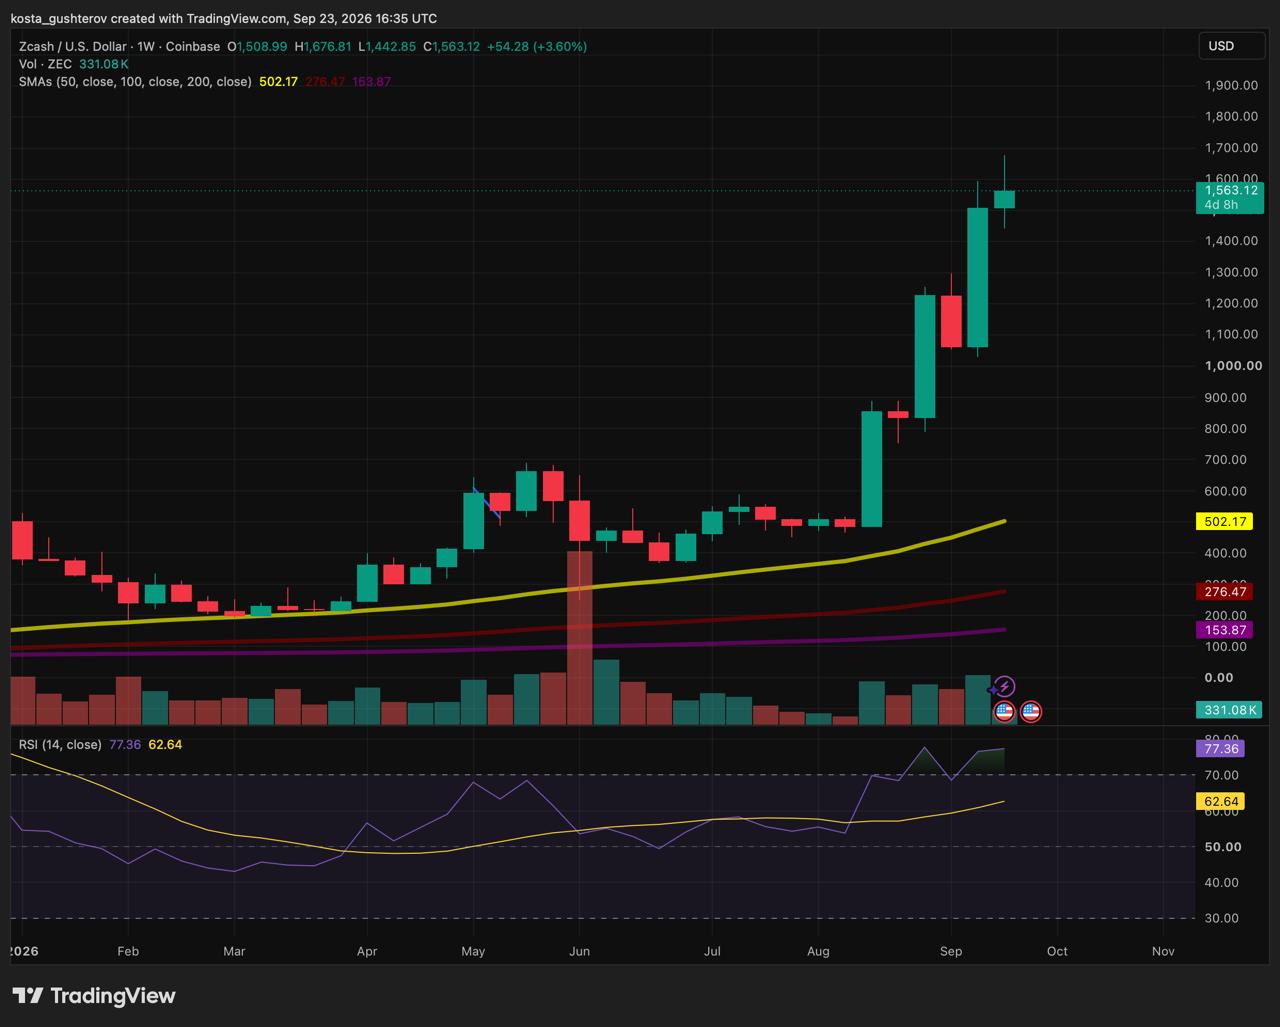
The weekly picture looked different. ZEC remained 3.6% higher for the week at 16:35 UTC, with more than four days left before the candle closed.
The daily relationship is a developing bearish divergence: ZEC has moved above its earlier price peak, but RSI has failed to match its previous reading above 80. The weekly chart does not show the same weakness. Its higher RSI reading continues to confirm the larger move.
ZEC’s distance from its moving averages shows how extended the move has become. Price was approximately 73% above the 50-day average near $904 and about 211% above the 50-week average near $502. Those averages support the longer trend, but they are too far below the market to guide the current pullback.
The next decision starts at $1,600
The upper boundary also rises over time, so the channel should not be treated as a permanently fixed price. The ranges above describe where its lines sat when the chart was captured.
Why $1,370 matters more than the round numbers
The Fibonacci retracement on the daily chart runs from the earlier low near $360 to the September high at approximately $1,680. Its first retracement level sits at $1,370.
That number gains relevance because the rising channel approaches the same area. A Fibonacci line on its own is only a measurement. Here, it overlaps with the structure connecting Zcash’s higher lows, giving traders two independent reasons to monitor the same region.
A brief move beneath the line would provide limited information in such a volatile market. A daily close below it would be more significant because ZEC would have lost both its first measured retracement and the channel supporting the accelerated rally.
The next Fibonacci level is near $1,175. It also sits near a previous area of consolidation, making it the first defensible fallback if the channel breaks. The 50% retracement near $1,021 would matter only after a substantially deeper decline.
What the chart cannot explain
The price move has developed alongside a proposal to reduce Zcash’s target block interval from 75 seconds to 25 seconds. The official ZIP 218 specification remains a draft and proposes introducing the change through NU7.
The shorter interval would aim to reduce confirmation times. Rewards per block would also be adjusted so expected daily ZEC issuance remained broadly unchanged. Our earlier examination of what the shorter Zcash block proposal would change covers the mechanics and remaining implementation work.
The proposal may have contributed to demand, but available data cannot separate upgrade-related buying from speculative trading, position changes or wider interest in privacy coins.
Interest rates provide another influence outside the chart. Higher government-bond yields can make speculative assets less attractive by offering investors more return without taking crypto-level risk. Lower yields can improve conditions for risk assets, although they do not determine ZEC’s direction on their own.
Reuters reported that Bitcoin and crypto-linked stocks advanced earlier in the week as oil and Treasury yields declined. That provides context for the wider rally, but it does not establish what caused ZEC’s latest daily candle.
For this analysis, yields are background pressure rather than a confirmed explanation for the pullback. The weaker daily RSI and rejection near an established price high already provide a chart-based reason for traders to take profits.

Three daily closes would send different messages
- A close above $1,680 would confirm another breakout.
ZEC would clear the repeated high and remain in the upper portion of its rising channel. The displayed period contains no tested horizontal resistance directly above it, so another target would require a longer historical chart or a separate projection. - A close between $1,500 and $1,680 would leave ZEC consolidating.
The bearish daily divergence would remain relevant, but buyers would still be defending the nearest support. Price could spend several sessions within this range without resolving the larger direction. - A close below $1,500 would bring the channel test into view.
The decisive reaction would then come near $1,370. Holding that area would preserve the sequence of higher lows; closing below it would expose the deeper retracement around $1,176.
ZEC can fall further without breaking its weekly uptrend. The more important signal would be a daily close below roughly $1,370, where the 23.6% retracement meets the trendline drawn through the higher lows. That would place price beneath the support guiding the rally, rather than simply lower within the same channel.
This article is provided for informational purposes only and does not constitute financial or investment advice. Cryptocurrency prices and technical indicators can change rapidly, while incomplete daily and weekly candles may look different by the close.



Alexander Zdravkov is a market analyst and crypto journalist with interests in economics, broader financial markets and digital assets. His journey into crypto began more than four years ago, driven by a fascination with the rapid evolution of blockchain technology and the transformative potential of decentralized finance. He began analyzing market cycles and identifying emerging trends before they reach the mainstream. He holds a degree in International Relations - a background that helped shape his broader perspective on global economics, geopolitics, and the interconnected nature of modern financial markets. Whether covering the latest developments in the crypto sector or exploring broader macroeconomic themes, Alexander focuses on giving readers context rather than simply repeating headlines. During his career, he has authored more than 5,000 articles covering cryptocurrencies, traditional finance, and global market developments. His work spans everything from Bitcoin and altcoins to macroeconomic trends influencing risk assets worldwide.