Zcash Price Falls 4.4%, Tests Support After 50-Day SMA Break

Zcash fell 4.45% on its October 14 daily candle, approaching $1,140 support after slipping below its 50-day moving average.
ZEC tests $1,140 after a 31% decline from its peak
ZEC traded near $1,163 on October 14 at 15:22 UTC, according to the ZEC/USD daily chart on TradingView. Its intraday low near $1,145 brought it close to the 38.2% Fibonacci retracement at $1,140.
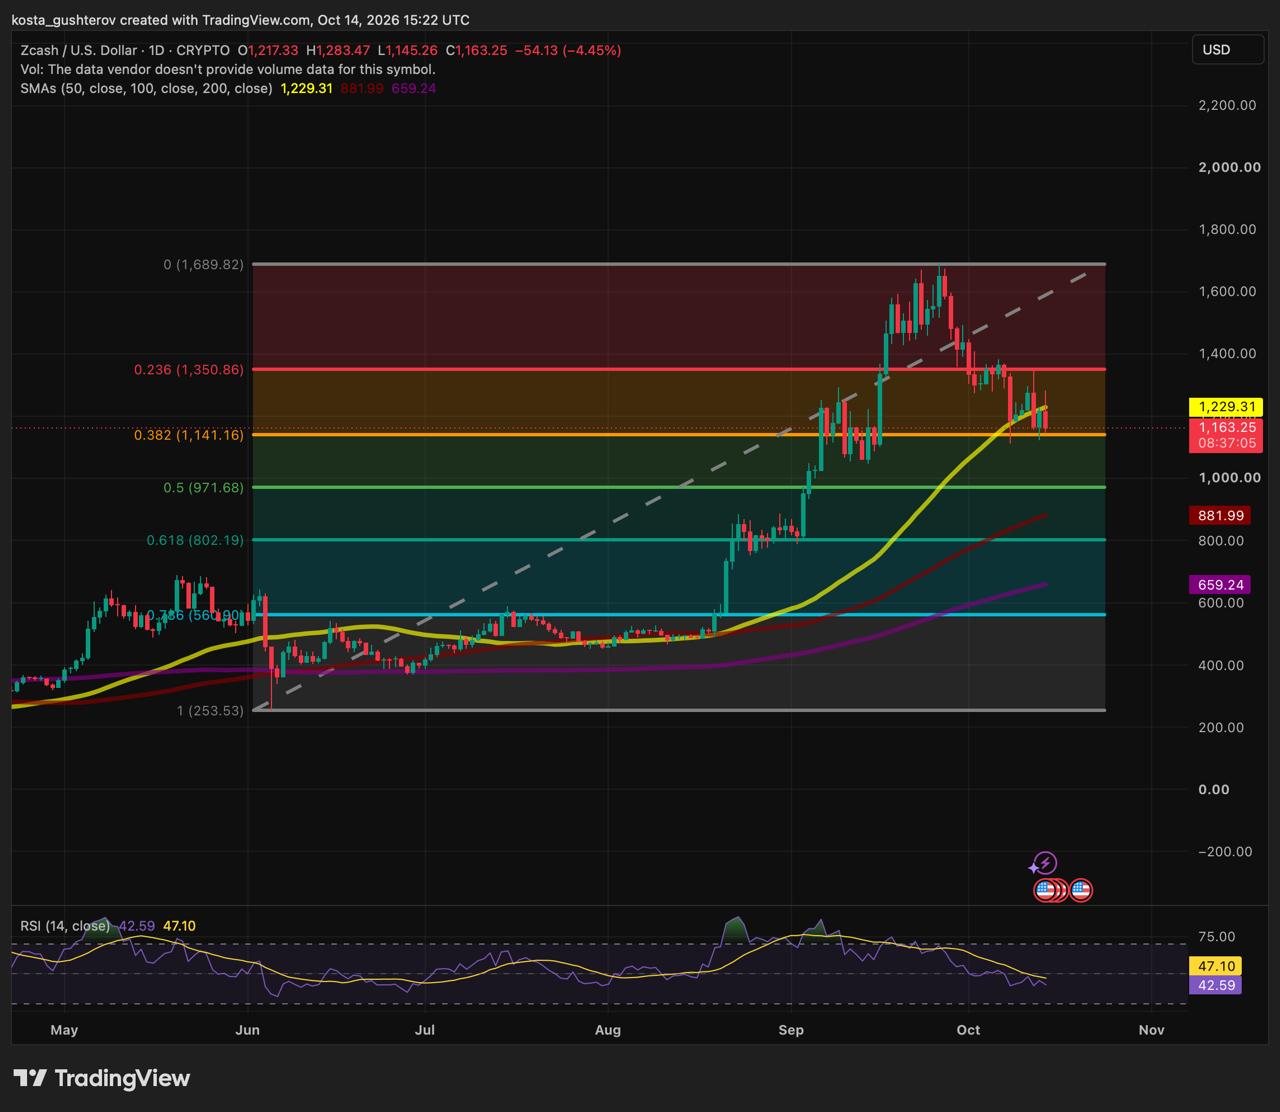
The Fibonacci levels track the advance from $250 to $1,690. ZEC is now approximately 31% below that peak, following a rally that saw Zcash overtake Hyperliquid.
The $1,140 area has already been tested several times in recent days. Some candles briefly dipped below it before recovering, leaving lower wicks around the same price band. Those reactions show that buyers have repeatedly stepped in near support, although the rebounds have yet to reverse the decline.
This makes the current move another test of an existing floor. A brief dip beneath $1,140 would follow the pattern of recent sessions. A daily close below it followed by a failed recovery would be a clearer sign that the support is weakening.
The area also overlaps with September trading, when ZEC moved through this band before accelerating higher. It now combines a Fibonacci retracement with both earlier consolidation and several recent price reactions.
ZEC recovered modestly from its latest intraday low, but the daily candle was still open. The recent candles show a narrowing gap between support near $1,140 and the rising 50-day SMA above it: buyers have defended the lower area, while recovery attempts have struggled around the average.
The 50-day SMA stands in the way of a rebound
The 50-day simple moving average near $1,230 is the first potential hurdle for a rebound. Holding $1,140 would help contain the decline, but recovering the average would strengthen the case for a recovery.
Above it, the 23.6% Fibonacci retracement near $1,350 is the next upside level to watch. A recovery through that area would bring the earlier peak near $1,690 back into consideration.
Daily relative strength index, or RSI, was near 42.6, below the neutral 50 level and consistent with weaker momentum. It remained above the usual oversold threshold of 30.

Losing $1,140 would bring $970 into focus
A daily close below $1,140 followed by a failed recovery would bring the 50% Fibonacci retracement near $970 into focus. That level sits just below the round $1,000 mark.
Further down, the rising 100-day SMA is near $882. The 61.8% Fibonacci retracement lies lower, near $800, providing a separate reference if the correction extends.
The $800 area also overlaps with ZEC’s early September consolidation, when price traded around $800 before the rally accelerated. A return there would erase a larger portion of the advance and test whether that earlier trading area can provide support.
This article is provided for informational purposes only and does not constitute financial or investment advice. Technical levels and indicators are interpretive tools, not guarantees of future price movement.



Kosta has reported on cryptocurrency markets and blockchain infrastructure since 2020, bringing over six years of hands-on experience in the crypto industry built through daily tracking of markets, trends, and emerging blockchain developments. Specializing in Bitcoin on-chain analysis, institutional ETF flows, and digital asset price action, his work at Coindoo has been cited by other news agencies and consistently covers market developments with a focus on data-driven reporting across Bitcoin, Ethereum, Solana, and XRP. Over the years, Kosta has contributed to multiple crypto media outlets in different regions, authoring over 6,000 articles across the sector. His reporting spans cryptocurrency markets and the broader fintech industry, tracking not only price action but also the technological and regulatory forces shaping the ecosystem. To support his analysis, Kosta actively leverages on-chain data and metrics from leading platforms such as Santiment, Glassnode, and CryptoQuant, enabling deeper, evidence-based market insights. He believes in the power of transparency and the data that underpins the blockchain ecosystem. His academic background in Marketing Management from Denmark further complements his analytical approach, adding a strong understanding of communication strategy and content positioning to his work.