Ethereum Price Jumps 7% Into the $2,500 Ceiling: Levels to Watch

Ethereum jumped more than 7% on Wednesday, lifting it from the $2,270s to just beneath the band where its October rebounds kept stalling, with the daily candle still open.
Key Takeaways
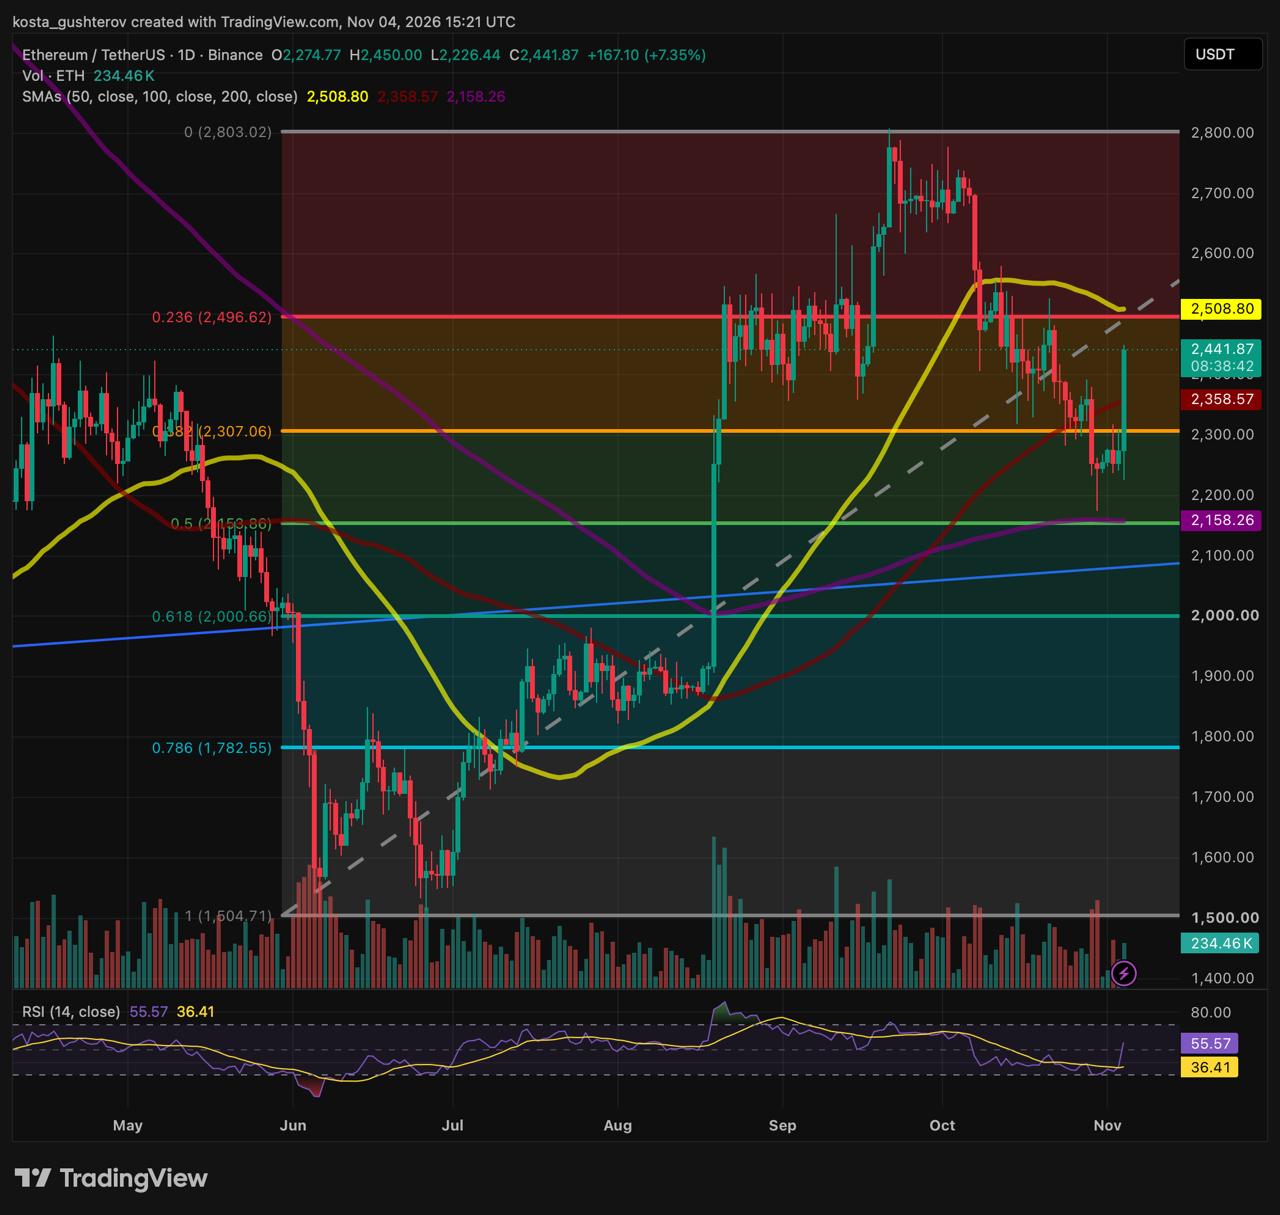
ETH traded at $2,442 at 15:21 UTC, up $167 on the day, according to TradingView’s Binance ETH/USDT chart.
One Session Through the Broken Zone
Our November 1 analysis caught ETH just after a flush into the 0.500 Fibonacci level near $2,154 and the 200-day SMA. It marked the broken zone between the 0.382 retracement near $2,307 and the 100-day average as the first area to test. Today’s candle covered that ground in one session. It opened at $2,275, dipped to $2,226 and then climbed through both levels, leaving ETH about $83, or 3.5%, above the 100-day SMA at $2,359.
That is a $224 range from low to high, and the candle still has hours to run. Whether the move above the 100-day counts as a daily reclaim depends on the daily close.
What Moved Since November 1
How the daily readings changed between the two snapshots:
| Daily reading | Nov 1 | Since then |
|---|---|---|
| ETH price | $2,269 | +$173 |
| 50-day SMA | $2,517 | −$8 |
| 100-day SMA | $2,346 | +$13 |
| 200-day SMA | $2,159 | −$1 |
| 14-day RSI | 33.83 | +21.74 |
| RSI signal line | 36.48 | −0.07 |
Snapshots taken at 16:48 UTC on November 1 and 15:21 UTC on November 4.
The RSI jump took the 14-day reading to 55.57, above both the 50 midline and its signal line at 36.41, after dipping close to oversold territory in late October. The averages tell a slower story. The 100-day kept rising while the 50-day kept sliding, cutting the gap between them from $171 to $150, a sign that October’s selling still weighs on the shorter average.
The Band Where October’s Rebounds Stalled
The 0.236 retracement around $2,497 and the 50-day SMA at $2,509 lie only $12 apart. ETH consolidated across this resistance band from late August to mid-September, broke down through it in October, and has stalled around it on each rebound since. On the higher timeframe, the November 1 analysis placed the 50-month average at $2,471, just beneath the band.
The session high of $2,450 stopped $47 short of the 0.236 level and below that monthly line as well, and ETH trades about 2.2% under the Fib. The 50-day half of the ceiling is drifting down toward price, while the Fib level stays put. Above the band, the chart shows a second consolidation area around $2,700 from late September and early October, and the cycle peak at the 0 Fib near $2,803.
A one-day 7% run into the 50-day average is also how October’s rebounds looked before they stalled. If the band holds again, this move would mark a lower high under October’s peak.
Checkpoints for the Next Closes
Three outcomes, each defined by where ETH closes. The nearest test is the 100-day SMA at the 00:00 UTC close.
A pullback that holds
A controlled dip that stays above the 0.382 level near $2,307 and the 100-day SMA would set a higher low beneath the ceiling and keep a second attempt at $2,500 open. A daily close back below $2,226, today’s low, would cancel the rebound structure.
The band turns price back
Exhaustion wicks, fading volume or a bearish engulfing candle inside the band would point to a lower high. A rotation from there could run back through $2,307 toward the 0.500 level near $2,154 and the 200-day SMA at $2,158, the floor tested at the end of October. Sustained daily acceptance above $2,520 to $2,550 would rule this path out.
Buyers take the ceiling
A daily close followed by successful retest and acceptance above $2,510 would clear both the 0.236 level near $2,497 and the 50-day SMA. That would leave the $2,700 consolidation area and the $2,803 peak as the next references above.
Wider frame: the 0.500 and 200-day cluster remains the line for the broader uptrend. Beneath it, the 0.618 retracement near $2,001 lies next to the round $2,000 mark, with the rising trendline around $2,080 just above it.
This article is provided for informational purposes only and does not constitute financial or investment advice. Technical levels and scenarios do not guarantee future price movement.



Alex is Editor-in-Chief of Coindoo and co-founder of Millennial Media Group, with nearly a decade of experience covering financial markets - crypto first, then everything else. It started in 2016 with Bitcoin. Like most people at the time, he didn't fully understand it - so he kept digging. Blockchain, tokenomics, the projects, the cycles. That curiosity never stopped, and eventually pulled him into traditional markets too: equities, commodities, macro. Not because he left crypto behind, but because you can't properly understand one without the other. What drives him is straightforward: he wants to know why something is happening, not just that it's happening. Most market coverage stops at the headline - price up, price down, here's a chart. Alex finds that kind of reporting actively unhelpful. If you walk away from an article without understanding the mechanism behind the move, what did you actually learn? He holds a degree in Tourism from New Bulgarian University - not the most obvious path into financial markets, but markets have a way of pulling in people who are simply too curious to stay out. He has authored over 200 in-depth analyses and more than 10,000 articles across crypto and traditional finance. He still thinks every day in markets teaches him something new. That's probably why he hasn't stopped.